Housing NEXT Needs Update (2025)
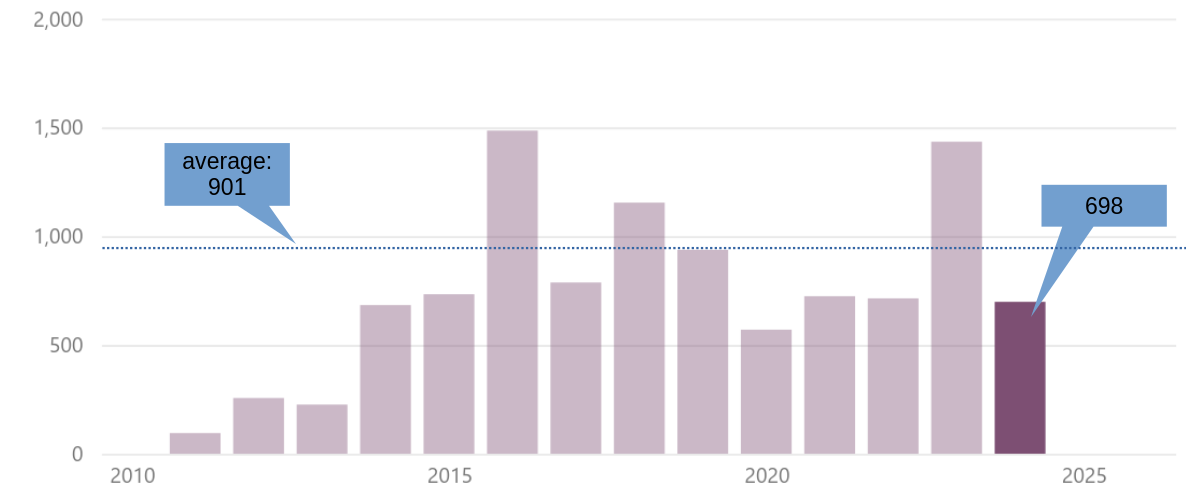
In June the City Commission received, with remarkably little fan faire, the second major update to the 2020 Housing Next study. This time the study includes estimates for the years 2025 through 2029. The briefest possible summary of the update is “status quo”. No appreciable progress has been made regarding the “Housing Crisis”, with the city having a demand for 3,308 – 3,940 units per year in order to reach a stabilized housing market. In the previous decade the city has been creating, on average, 901 units per year; ~25% of that demand. This is an astonishing deficit of between six (6) and eight (8) housing units per day. As a write this on a Monday, by the weekend, the city will have not created 30 – 40 units required to reach something like housing price stabilization.
Housing Production
|
The details of the demand, through 2029, are need for 6,990 new rental units and 6,333 new rental units. If households which are currently paying more than 50% of their income for housing are factored in – these households are categorized as “severely cost burdened” - that number swells to 8,837 new rental units and 6,923 new for-sale units. This is a total range of 13,232 – 15,760 housing unis (3,308 – 3,940 units per year).
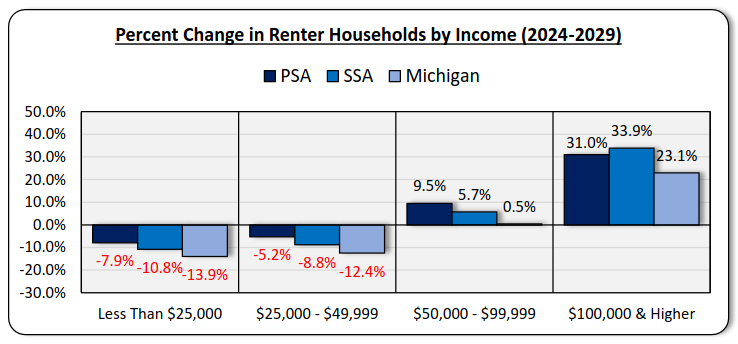
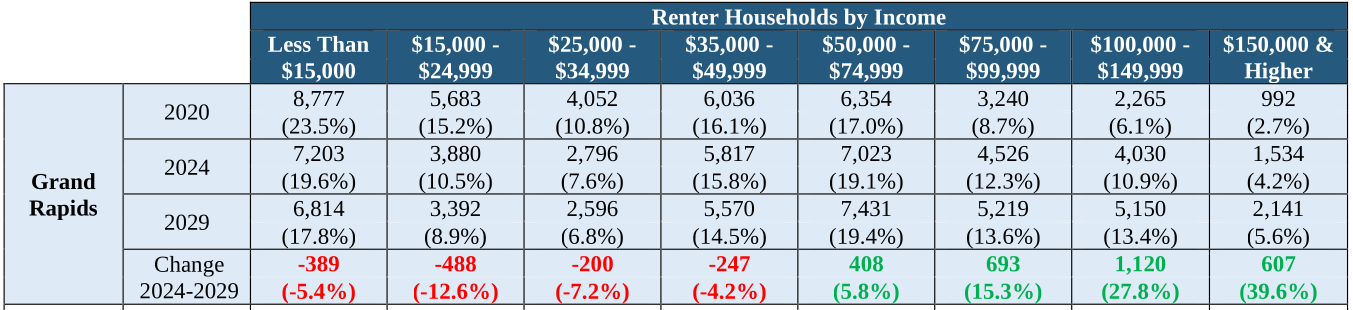
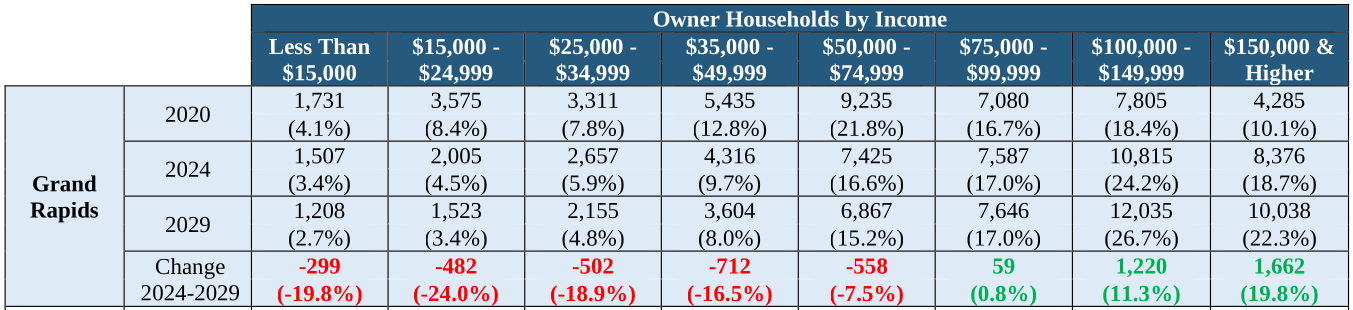
As in the original study (2020), and the 2022 update, the largest economic cohort of households (at 31%) moving into the city are those earning more than $100K/yr. Thus the creation of abundant Market Rate housing is a critical aspect of protecting the affordability of existing housing stock; if no economically matched – 30% a month for a household earning $100,000/yr is $8,333/mo – is created these households will “step down” in the market to purchase housing to upgrade. Because they can.
The competition for housing in neighborhoods remains driven by many of the same factors as prior to the pandemic - which we've been told "changed everything" - while the data continues to demonstrate changed very little of anything. Research by NAR (National Association of Realtors) finds - after the pandemic - that more than three-quarters of those in the housing market are willing to pay a premium to live in a walkable neighborhood, and that share is higher than 90% for Gen-Z.
Income Cohorts
|
|
|
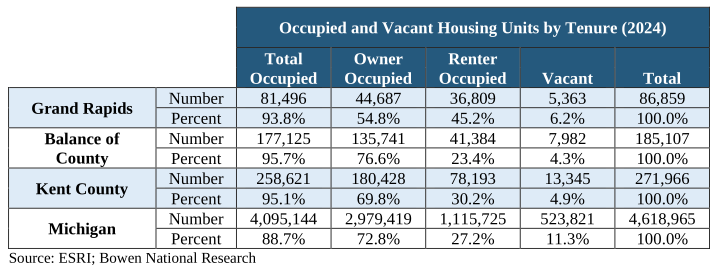
Vacant housing is not a thing; as convenient an explanation for the Housing Crisis as that might provide. Remember that some vacancy occurs naturally due to life events as well as delays between permitting and leasing or selling of new housing. A single digit percentage of any housing type will always be vacant as people move, sell, purchase, lease, and ... well ... die, putting re-occupancy of that housing on the timeline of the American legal system.
Vacancy
|
Likely the most striking shift in the data is the expectation that senior households (65yrs old +) which is currently only 9% of households in the city is expected to increase by 22% by 2030, an increase of 1,635 senior households. This tracks with both the overall aging of the American population as well as one of the city's few housing success stories: the creation and expansion of multiple senior oriented living facilities (Beacon Hill (1845 Boston Street SE), Leonard Apartments (851 Leonard St NW), South Gate (438 Division Ave S), Avenue Apartments (1300 Madison Ave SE), 2480 Lake Michigan Dr NW, ...) This is one sector of the housing market where the private sector is sufficiently incentivized to overcome the City Commission's stubbornly obsolete land-use policies.
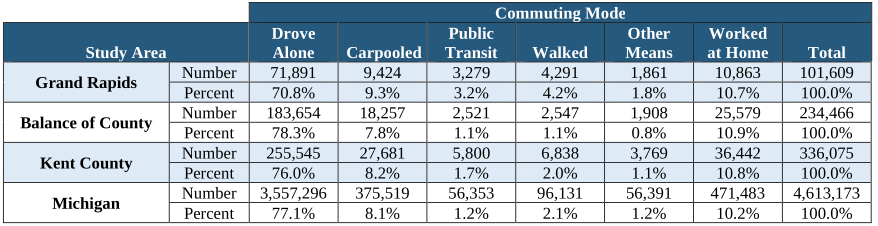
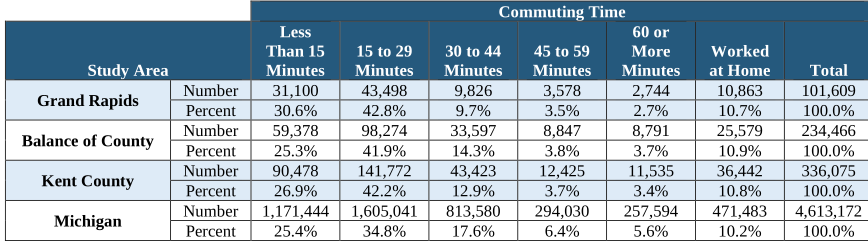
A standout data point from the study is that total employment for Kent County increased by 14.4% between 2014 and 2024, including a 16% increase in citizens who both reside in and work in the county. So called "in place" employment is a boon for local tax revenues. Grand Rapids, even as badly as local government has neglected the transportation system, maintains a significantly higher share of non-drive-alone commuters than the outlying community. Grand Rapids residents also benefit from shorter commute times.
Communting Statistics
|
|
Despite a consistent narrative in the mainstream media about good American families being able to "flee" to the suburbs "thanks to" post-pandemic work-from-home policies note how the share of work-from-home workers is essentially identical comparing the city and the county. This is an excellent example of Data-Vs-Narrative.
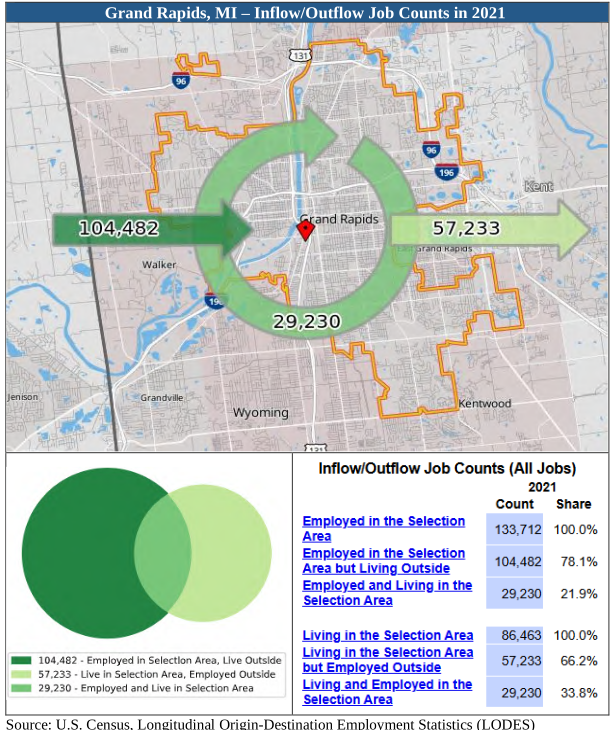
Of the 86,463 citizens of the city who are employed 29,230 (33.8%) are employed in the city; while 104,482 employees from outside the city commute in. Commuters account for ~78% of employees employed in the city. This represents a significant potential for residential development, reducing VMT (Vehicle Miles Travelled) [which is a Climate Goal, right?], and substantially adding to the city's tax base.
Aside: The commuting data in the Housing Next study is from 2021, so it is possible it is a bit stale. Downtown employment has continued to increase, and the Rapid's ridership has seen rebound in 2022 - 2025.
Communting Flow
|
Related
- Housing Step Down, StrongtownsGR 2024-04
- Housing NEXT Needs Assessment Update: 2024, PDF 2025-06 👈 The Report
- Housing NEXT Needs Assessment Update: 2022, PDF
- Housing NEXT: Presentation (PDF), Report (PDF) 2020-07
- Housing Kent Data Dashboard, Housing Kent 2024-04
- Housing Kent: State of Housing 2024 Report, published 2025-02-17
- The Housing Ready City, Strongtowns 2025-04
- Housing NEXT Presentation 2025-10-09, UrbanGR 2025-10-09