Affordability Tables 2025
Given that we are about to enter into a season of constant housing and land-use policy conversation it seems like a good time to update the "A"ffordable housing tables. The standard for "A"ffordabilty is for the total monthly housing costs not to exceed 30% of gross household income. For the state and federal governments this calculation is always made off of the median household income of the county; that is the number which matters in the context of block grants, tax credits, etc... I am including the city of Grand Rapids table here for reference.
The median household income for Kent county is $80,390/yr, the city of Grand Rapids is $65,526/yr. The median household income of the city is 78% that of the county.
The Housing, Transportation, and H+T (Housing + Transportation) columns are the respective percentages of household income divided by twelve (12) to produce a monthly value.
Aside from the governments "30% rule" there is a school of thought that housing and transportation should not total more than 50% of gross income; H+T recognizes the trade-off which almost always occurs between housing costs (higher in urban areas) and transportation costs (lower in urban areas).
The government's official Affordability calculations also index to family size, these are straight-line calculations of household income, to serve as metrics and parameters in conversation.
City of Grand Rapids
| % | Houehold Income/yr | Housing (30%)/mo | Transportation (20%)/mo | H+T (50%)/mo |
|---|---|---|---|---|
| 20% | $13,105 | $327.63 | $218.42 | $546.05 |
| 30% | $19,658 | $491.45 | $327.63 | $819.08 |
| 50% | $32,763 | $819.08 | $546.05 | $1,365.13 |
| 60% | $39,316 | $982.89 | $655.26 | $1,638.15 |
| 80% | $52,421 | $1,310.52 | $873.68 | $2,184.20 |
| 100% | $65,526 | $1,638.15 | $1,092.10 | $2,730.25 |
| 120% | $78,631 | $1,965.78 | $1,310.52 | $3,276.30 |
| 150% | $98,289 | $2,457.23 | $1,638.15 | $4,095.38 |
| 200% | $131,052 | $3,276.30 | $2,184.20 | $5,460.50 |
Kent County
| % | Houehold Income/yr | Housing (30%)/mo | Transportation (20%)/mo | H+T (50%)/mo |
|---|---|---|---|---|
| 20% | $16,078 | $401.95 | $267.97 | $669.92 |
| 30% | $24,117 | $602.93 | $401.95 | $1,004.88 |
| 50% | $40,195 | $1,004.88 | $669.92 | $1,674.79 |
| 60% | $48,234 | $1,205.85 | $803.90 | $2,009.75 |
| 80% | $64,312 | $1,607.80 | $1,071.87 | $2,679.67 |
| 100% | $80,390 | $2,009.75 | $1,339.83 | $3,349.58 |
| 120% | $96,468 | $2,411.70 | $1,607.80 | $4,019.50 |
| 150% | $120,585 | $3,014.63 | $2,009.75 | $5,024.38 |
| 200% | $160,780 | $4,019.50 | $2,679.67 | $6,699.17 |
Related
- Lending, Race, and High Income Households, UrbanGR 2024-05
- The Myth Of The Out-Of-State Housing Hoover, UrbanGR 2024-04
- Housing Affordability tables from 2022-09, UrbanGR 2022-09
- Housing for only for the rich?, UrbanGR 2015-03
- What Is ‘Affordable Housing’?, Shelterforce 2025-01-23
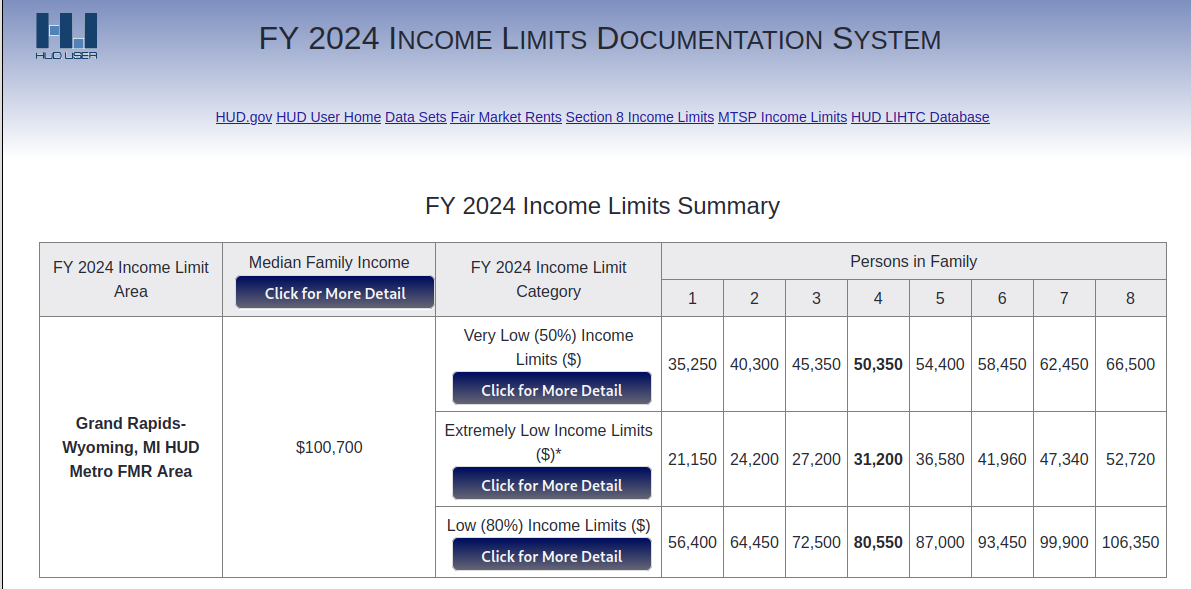
- FY 2024 Income Limits Documentation System, HUD 2025-04-08
- These numbers are for the "Grand Rapids-Wyoming, MI HUD Metro FMR Area" area. HUD (Housing & Urban Development) uses the area definitions of the OMB (Office of Management and Budget). These area definitions may or may not correspond to what any normal person means when they discuss area X. A screenshot of the table is here, for when the HUD website goes offline.