Data Point: ZORI 2025-06 (City vs. MSA)
It has been roughly six months since we last looked at the ZORI (Zillow Observed Rent Index) 👉here👈 where we compared across the cities of the Midwest. Here is a chart from the current data showing the value for the City of Grand Rapids vs. the Census Bureau's "Metropolitan Statistical Area" (MSA).
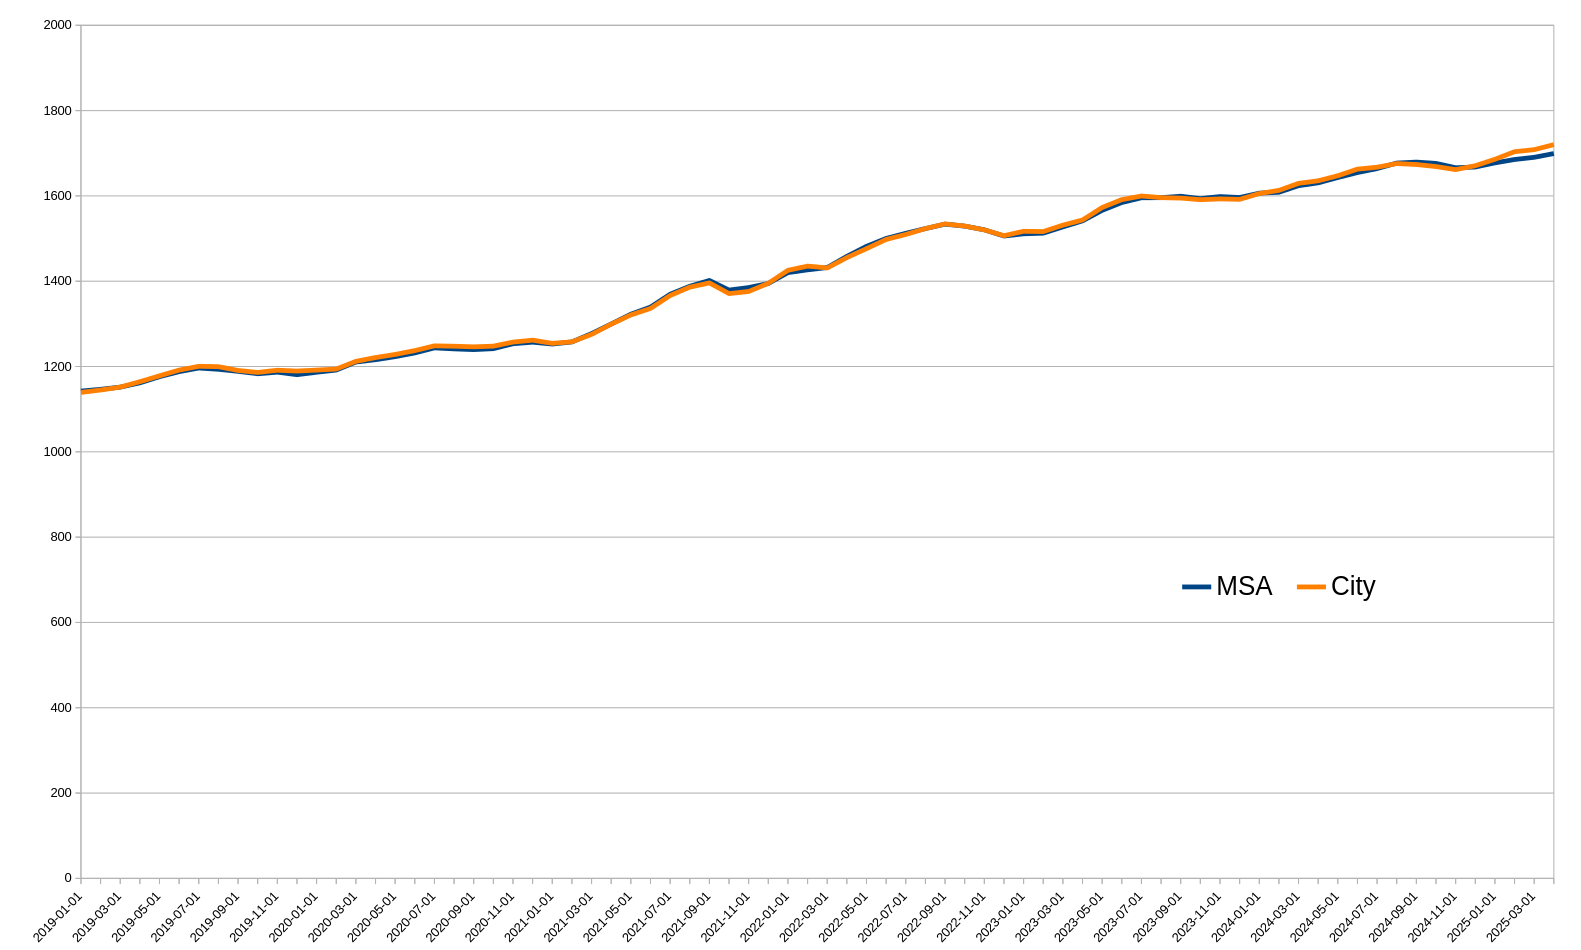
Are there two lines on that graph? Yes, but barely. From 2019-01 to 2025-04 the city saw a total per month increase of $557/mo, while the MSA saw an increase of $580/mo. The 2025-04 value of the MSA ($1720) is higher than that of The City ($1699).
This is interesting as the Grand Rapids-Wyoming-Kentwood MSA is vast; we looked at the city vs. the urbanized area vs. the MSA in 2023 👉here👈. One comment frequently heard in the housing conversation is that it is less expensive to move away from the city center. If that is true it does not appear in the data. Could be because the amount of housing in the city overwhelms that available in the larger area? Or is it more simply that the price advantage of more suburban areas, to the extent it ever existed, has evaporated as the city has continued to restrict the development of new housing? Also, the MSA contains higher income areas, and the population is older than that of city, which may skew this values upward for the MSA [again, see 👉here👈].
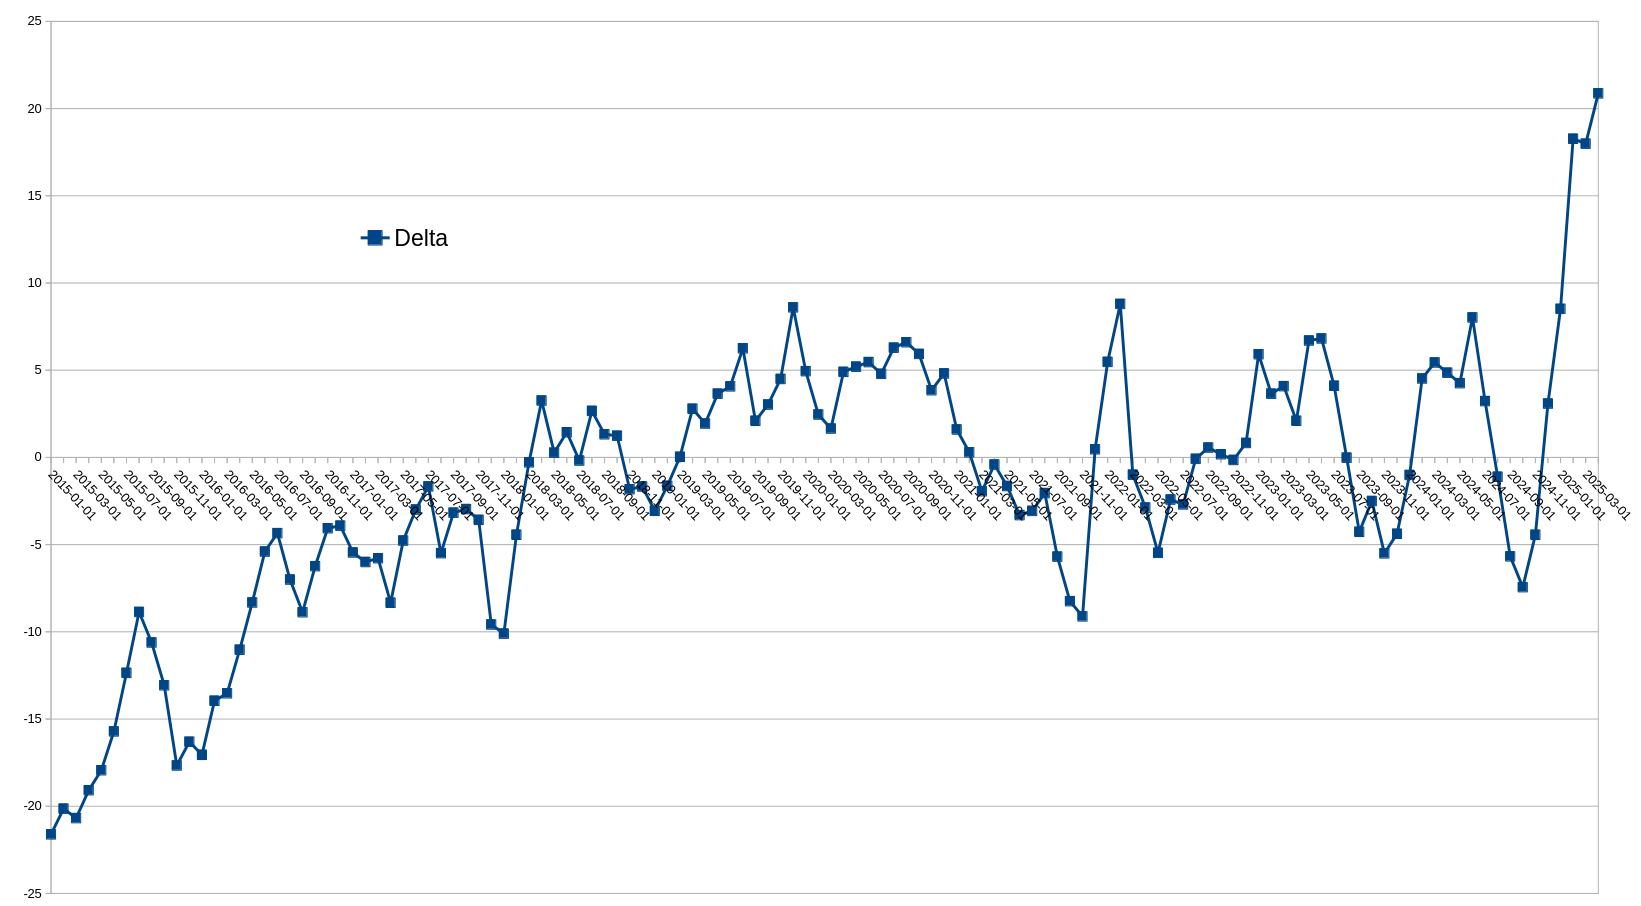
Going back to 2019-01 the MSA's value ($1142) was already higher than that of the city ($1139) by $3; that delta has increased to $20. The "housing crisis" dates back to ~$2015 when the MSA's value was ($864) and The City was ($842); a delta of $21, in favor of the city. So, was the exurban price advantage of [rental] housing ever real?
What is the zORI? It is the Zillow Observed Rent Index. A smoothed measure of the typical observed market rate rent across a given region. ZORI is a repeat-rent index that is weighted to the rental housing stock to ensure representativeness across the entire market, not just those homes currently listed for-rent. The index is dollar-denominated by computing the mean of listed rents that fall into the 35th to 65th percentile range for all homes and apartments in a given region, which is weighted to reflect the rental housing stock. You can find the details of the methodology 👉here👈,
If the price advantage of moving further from the economic center is this slight, even without factoring in increased transportation costs (H+T), conversations about "displacement" take on a different tenor: the status-quo is driving displacement, it is not the result of development.
The average ownership cost of a new car, driven ~15,000 miles a year, is $12,297/yr or $1,024/mo.
Source: Nerdwallet.com, 2025-03-07
Related
- Affordability Tables 2025, urbanGR
- H+T Index, Center for Neighborhood Technology (CNT)
- Cost of vehicle ownership, Nerdwallet
- A Look At The UZA, UrbanGR
- Zillow Research Data, Zillow