The Weather Theory
After the recent post about the declining growth projections for the city (Grand Rapids, MI) the topic of population growth has been on my mind. You notice things more when they are on your mind. Making regular appearance has been the common general-purpose theories which are used to short-circuit the population discussion; people love their grand theories. The most common of which is The Weather Theory. The Weather Theory posits that people move to “nice weather”; that weather is the principle explanation of why the rust-belt is hollowed out, why the mid-west does not grow, etc… This theory manifests itself everywhere. From conversations at the bar to the kind of top-ten lists shared on Linked In. On social media forums such as Reddit’s r/relocating a suggestion that a midwest city is somewhere someone should consider as a home is akin to tossing a pork chop into pool of piranha – it is a completely absurd notion that someone would want to live in a place which is frozen solid for six months of the year. The picture many people seem to hold in their mind of a Grand Rapids winter is:
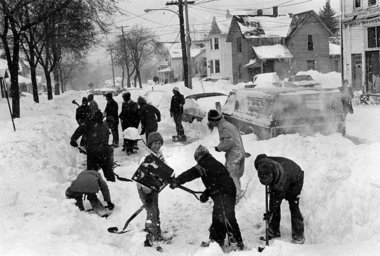 The winter of 1978, 47 years ago (assuming you are reading this in 2025) |
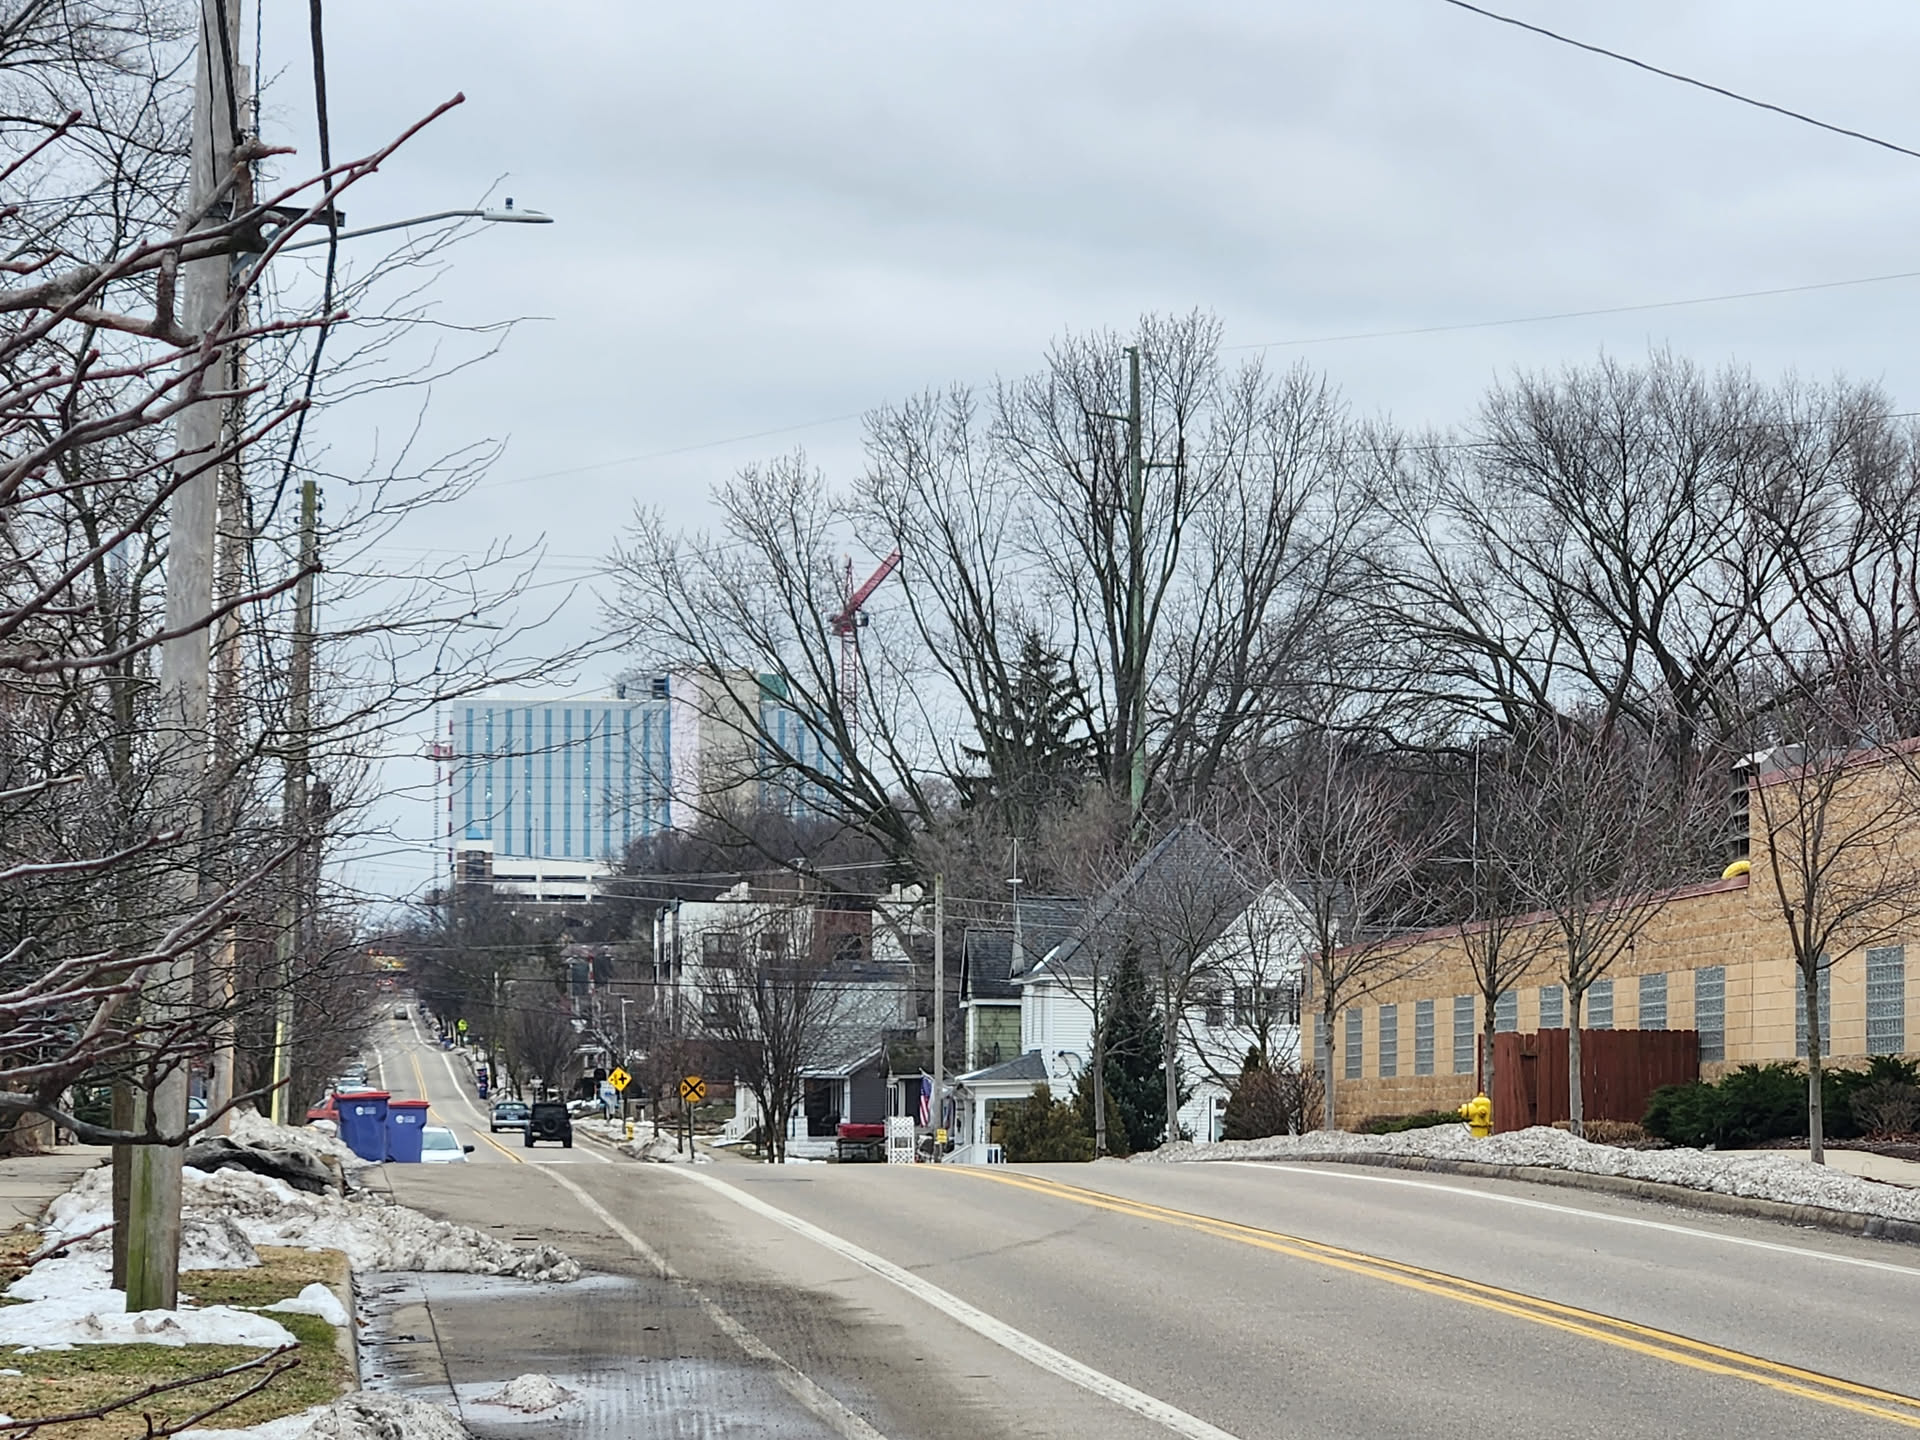
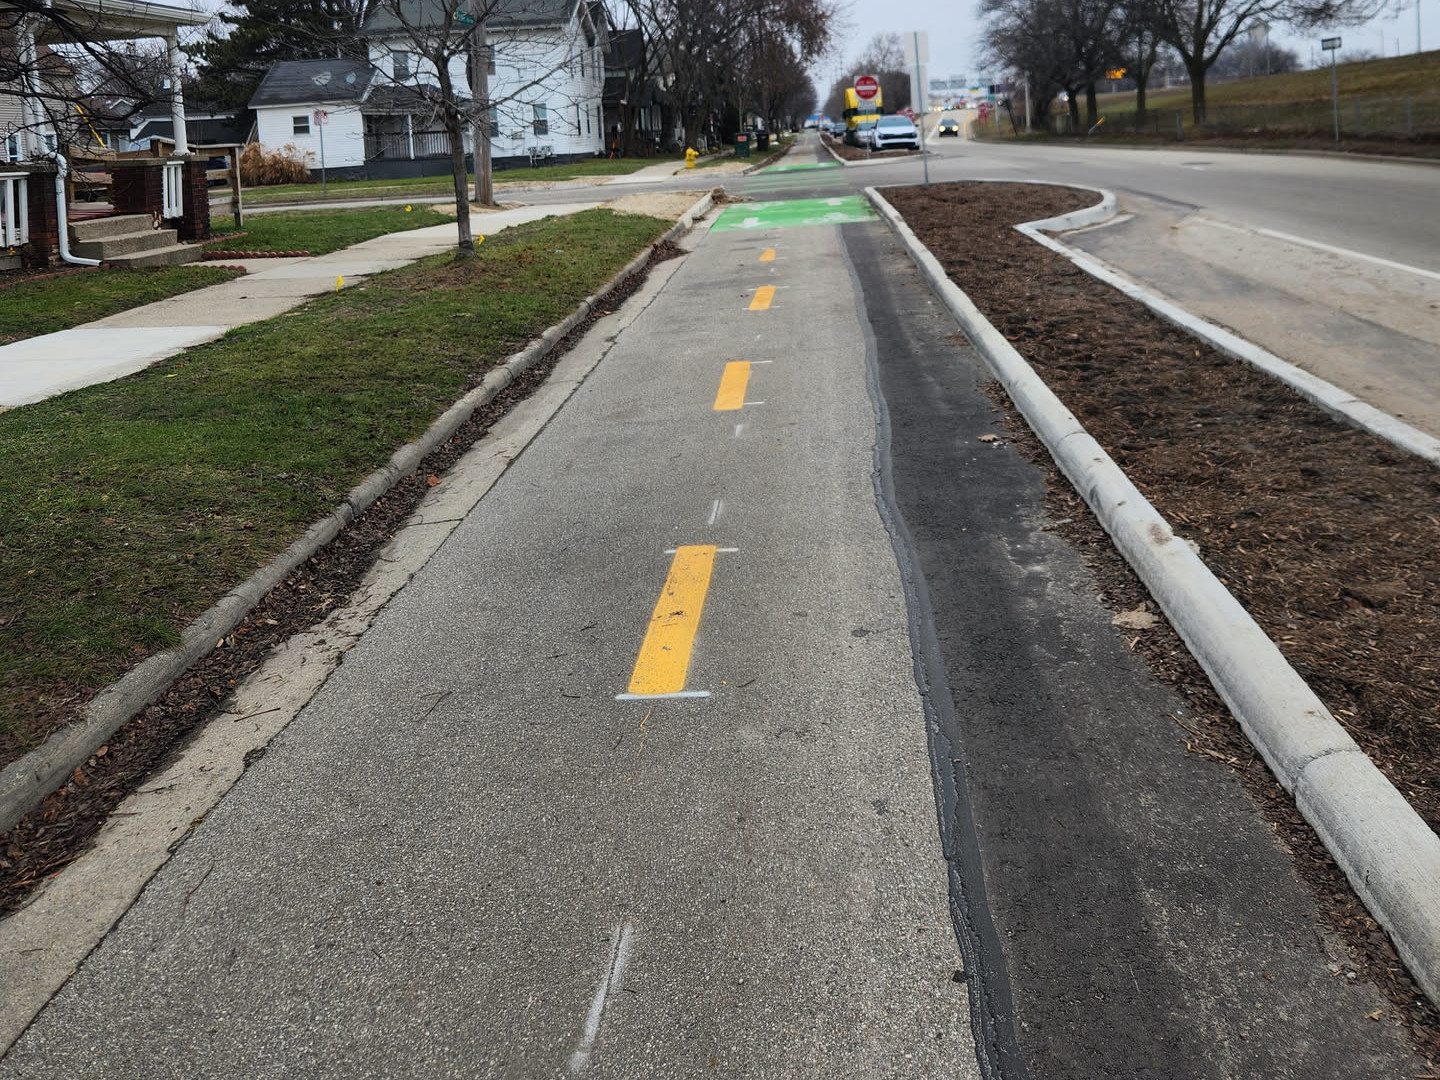
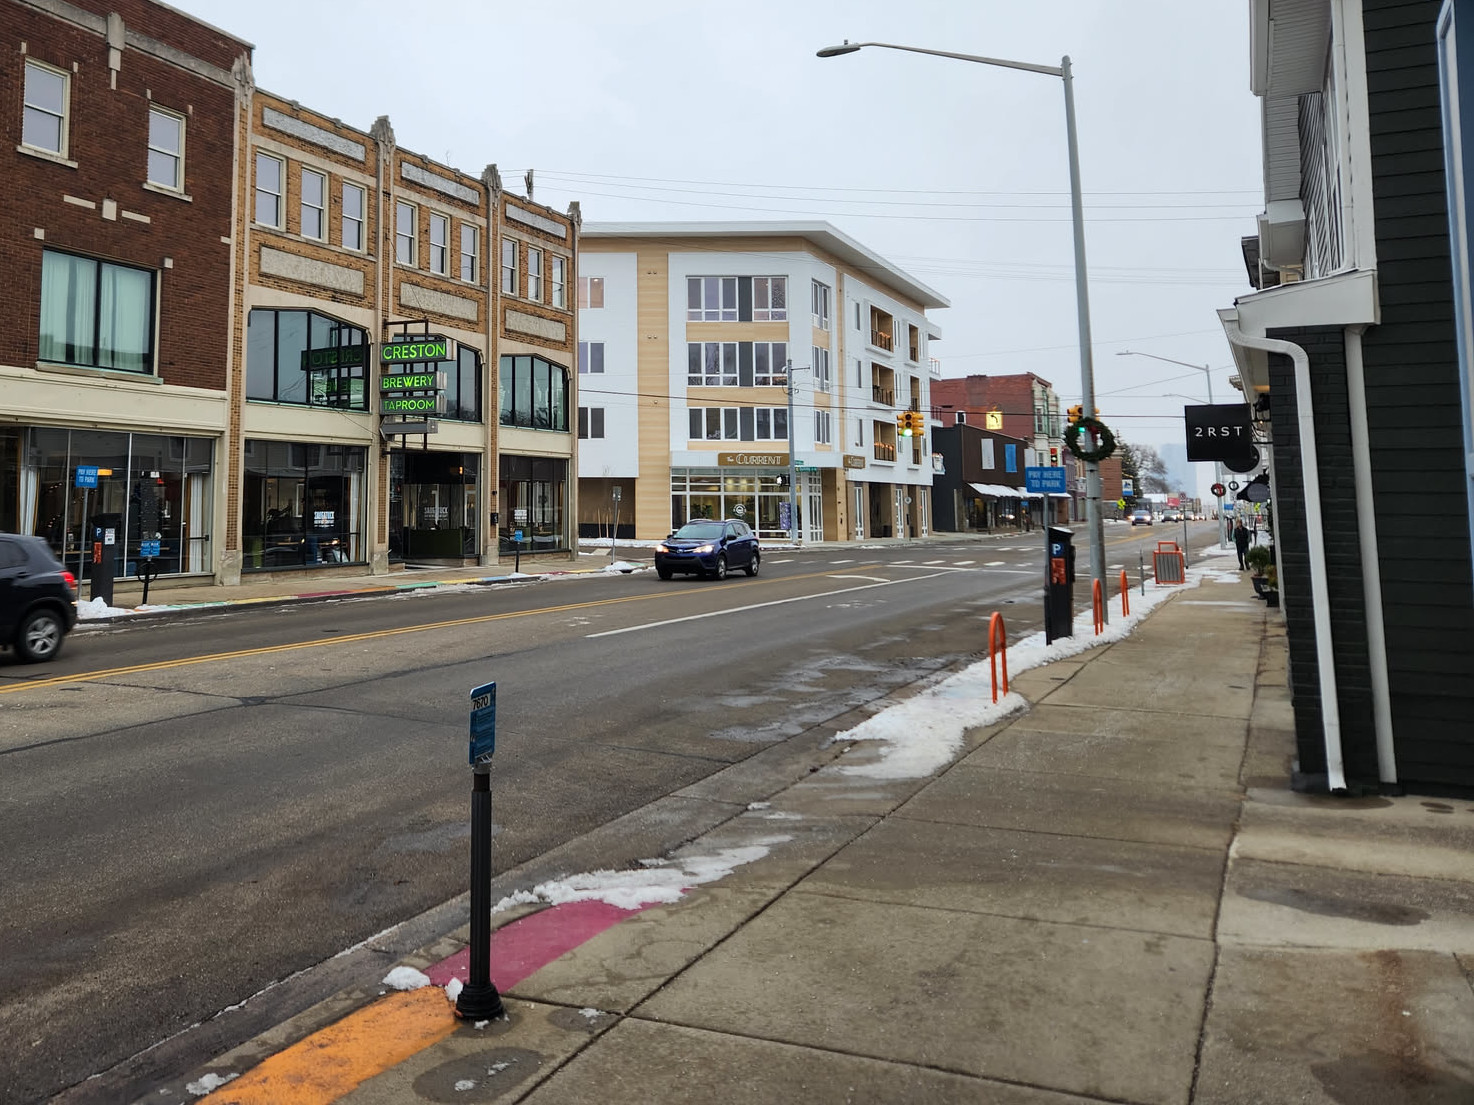
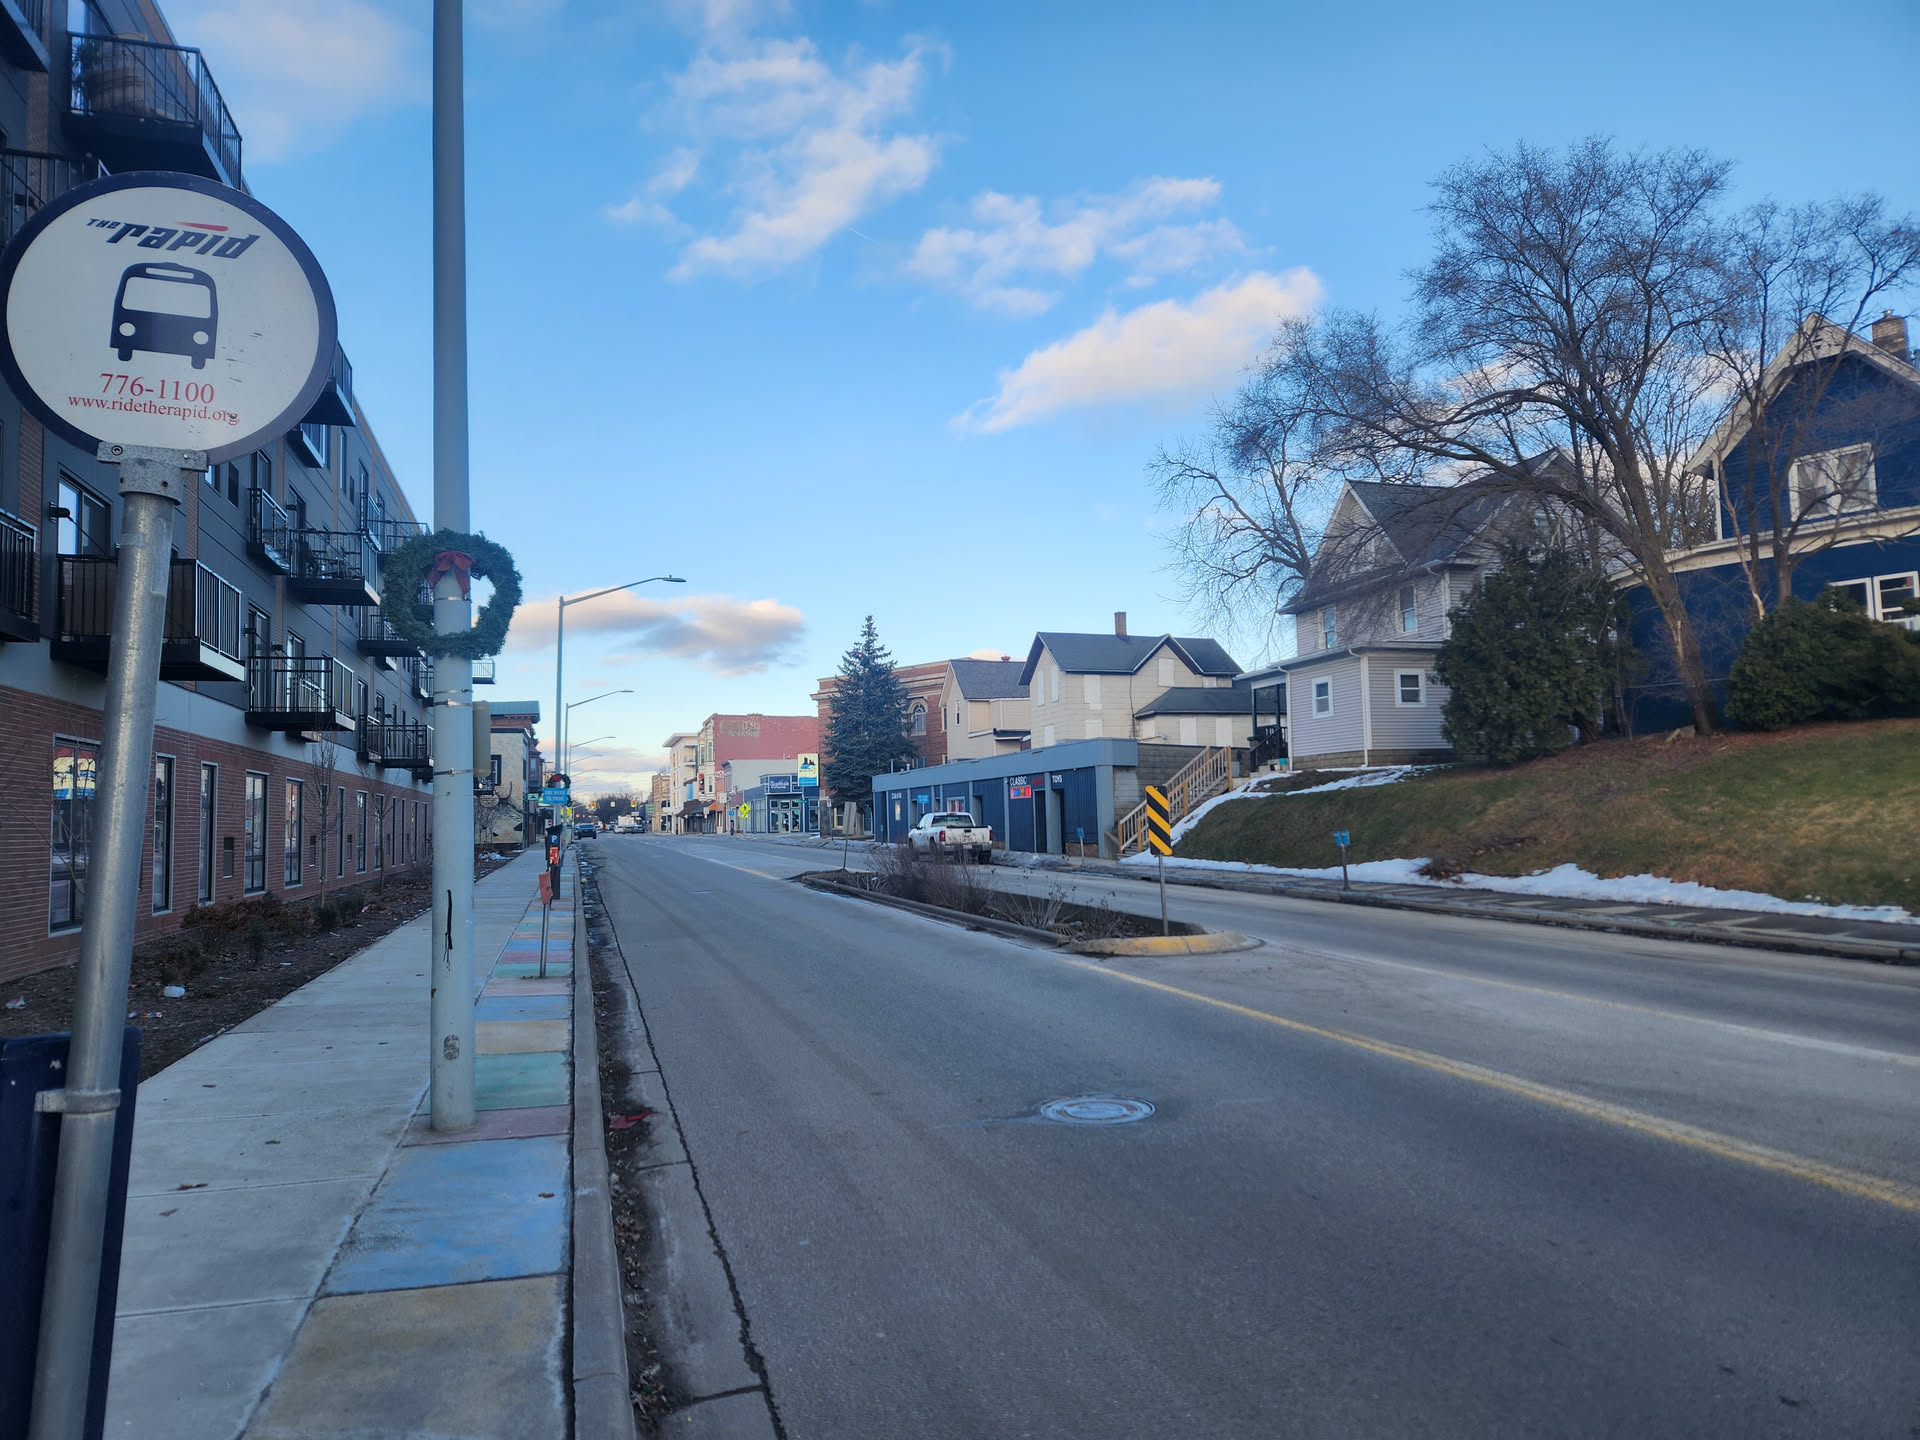
Meanwhile, recent winters in Grand Rapids are more like:
 2022-12-15 (Dec) |
 2022-12-26 (Dec) |
 2023-01-22 (Jan) |
 2023-01-31 (Jan) |
 2023-12-09 (Dec) |
 2024-01-14 (Jan) |
 2024-01-31 (Jan) |
 2024-02-03 (Feb) |
 2024-12-23 (Dec) |
 2025-01-25 (Jan) |
 2025-02-07 (Feb) |
 2025-02-24 (Feb) |
Of course, that is anecdotal. Anyone can choose a selection of photos to make winter appear to be mild or extreme. I did not do that, but, anyway, we also have data. To start with, what about growth? Is there a strong correlation between growth and climate? Here is a sample of cities, including two of the fastest growing cities in the nation:
| City Population | 1980 | 1990 | 2000 | 2010 | 2020 | Change | Change % |
|---|---|---|---|---|---|---|---|
| Pheonix, AZ | 789,704 | 983,403 | 1,321,045 | 1,445,632 | 1,608,139 | +818,435 | +103.6% |
| Dallas, TX | 904,078 | 1,006,977 | 1,188,580 | 1,197,816 | 1,304,379 | +400,301 | +44.3% |
| Boulder, CO | 76,685 | 83,312 | 94,673 | 97,385 | 108,250 | +31,565 | +41.2% |
| New York, NY | 7,071,639 | 7,322,564 | 8,008,288 | 8,175,133 | 8,804,190 | +1,732,551 | +24.5% |
| Minneapolis, MN | 370,951 | 368,383 | 382,618 | 382,578 | 429,954 | +59,003 | +15.9% |
| Ann Arbor, MI | 107,969 | 109,592 | 114,024 | 113,934 | 123,851 | +15,882 | +14.7% |
| Grand Rapids, MI | 181,843 | 189,126 | 197,800 | 188,036 | 198,917 | +17,074 | +9.4% |
| Traverse City, MI | 15,516 | 15,515 | 14,532 | 14,674 | 15,678 | +162 | +1.0% |
| Chicago, IL | 3,005,072 | 2,783,726 | 2,896,016 | 2,695,598 | 2,746,388 | -258,684 | -8.6% |
Aside: Post 2020, Chicago has seen a population increase of ~25,000 citizens, a notable reversal from its recent decline. Chicago is also an excellent example of a recent urban phenomenon: an increase in households parallel with a decrease in population. As some American cities become more affluent housing capacity is reduced as more affluent households consume more space, often by converting previous multi-family housing into single family housing, especially housing like Chicago's famous brick walk-ups which were 2-3 units flats (originally). Affluent households also tend to be households comprised of fewer individuals.
If we set our benchmark for strong growth at ~25% (over 40 years) then we have four winners: Pheonix, Dallas, Boulder, and New York. We have three also-rans: Ann Arbor, Grand Rapids, and Minneapolis. And then Chicago in the wandered-of-the-track-and-got-a-donut category. And how do these cities compare in terms of climate?
Aside: There is a second problem with measuring population growth: is a city in 2020 the city which it was in 1980? In the older parts of the nation the era of annexation and division has largely concluded. However, especially in the south west, this is not true. For example, in the full list of cities I looked at Las Vegas, NV popped off the top of the growth list at +289%. Yeah, that leaves Pheonix, AZ eating dust. The secret to that kind of growth? Gobbling up more land, and thus the residents who live there. Annexation is so common in Nevada cities that a mapping layer is provided which can be filtered by year. Most years have multiple annexations. Austin, TX which is another top-growth city in the news is also a land gobbler. Pheonix, AZ has had a few annexations since 1980 but nothing comparable to the other superstars [cheaters]. The super-annexers were disqualified.
Average Low Daily Temperature
| City | Jan | Feb | Mar | Apr | May | Jun | Jul | Aug | Sep | Oct | Nov | Dec |
|---|---|---|---|---|---|---|---|---|---|---|---|---|
| Boulder, CO | 22 | 18 | 24 | 36 | 39 | 50 | 57 | 58 | 51 | 31 | 26 | 24 |
| Traverse City, MI | 17 | 16 | 23 | 33 | 44 | 54 | 61 | 60 | 53 | 42 | 32 | 25 |
| Ann Arbor, MI | 16 | 18 | 25 | 36 | 47 | 56 | 60 | 59 | 52 | 41 | 31 | 22 |
| Minneapolis, MN | 9 | 11 | 26 | 38 | 51 | 61 | 66 | 64 | 56 | 42 | 28 | 16 |
| Grand Rapids | 18 | 19 | 27 | 37 | 50 | 59 | 64 | 61 | 54 | 43 | 32 | 26 |
| Chicago, IL | 17 | 19 | 30 | 39 | 51 | 61 | 66 | 65 | 58 | 45 | 32 | 24 |
| Dallas, TX | 37 | 41 | 50 | 58 | 66 | 75 | 78 | 79 | 72 | 59 | 48 | 41 |
| Pheonix, AZ | 46 | 49 | 56 | 62 | 68 | 80 | 85 | 84 | 78 | 66 | 54 | 46 |
| New York, NY | 27 | 29 | 35 | 46 | 59 | 64 | 71 | 69 | 63 | 53 | 41 | 35 |
Grand Rapids has four (4) [not six (6)] months with an average low temperature below freezing; compared to Boulder's five (5). Yet Boulder is solidly in our growth category.
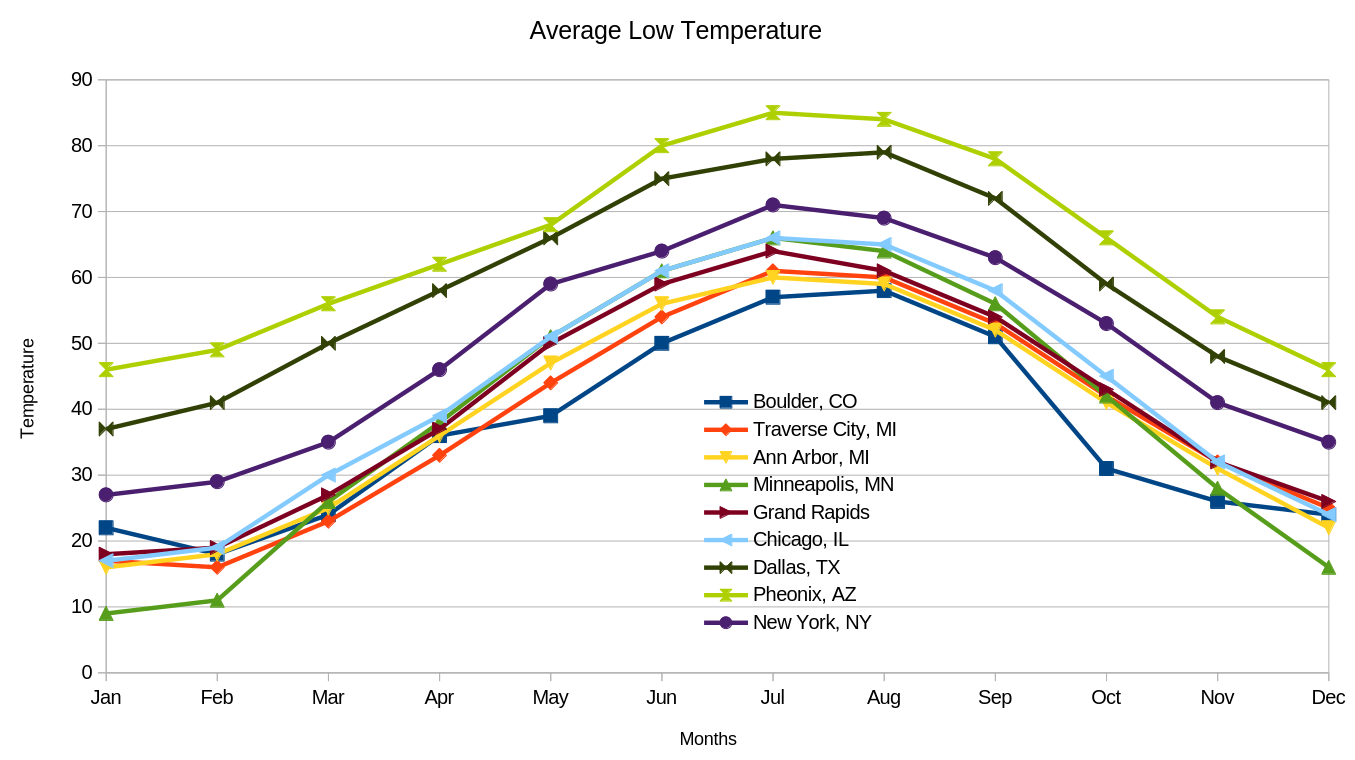 |
Note: All the averages are for the years 2010 - 2019. Due to this range the data does not include 2024 which was Michigan's warmest year ever recorded, or 2021 which tied with 1931 as the state's second warmest year.
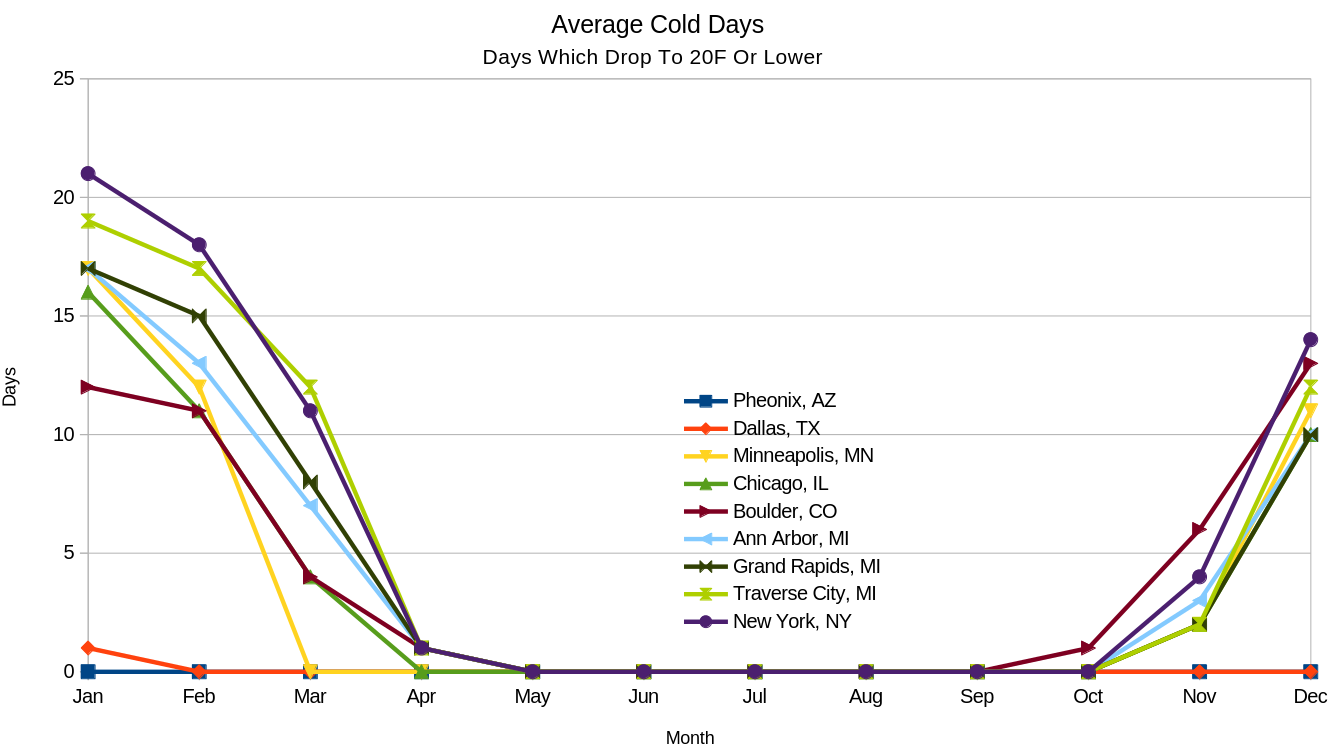
Average Cold Days Per Month (Low of 20F or below)
| City | Jan | Feb | Mar | Apr | May | Jun | Jul | Aug | Sep | Oct | Nov | Dec | Sum |
|---|---|---|---|---|---|---|---|---|---|---|---|---|---|
| Pheonix, AZ | 0 | 0 | 0 | 0 | 0 | 0 | 0 | 0 | 0 | 0 | 0 | 0 | 0 |
| Dallas, TX | 1 | 0 | 0 | 0 | 0 | 0 | 0 | 0 | 0 | 0 | 0 | 0 | 1 |
| Minneapolis, MN | 17 | 12 | 0 | 0 | 0 | 0 | 0 | 0 | 0 | 0 | 2 | 11 | 42 |
| Chicago, IL | 16 | 11 | 4 | 0 | 0 | 0 | 0 | 0 | 0 | 0 | 2 | 10 | 43 |
| Boulder, CO | 12 | 11 | 4 | 1 | 0 | 0 | 0 | 0 | 0 | 1 | 6 | 13 | 48 |
| Ann Arbor, MI | 17 | 13 | 7 | 1 | 0 | 0 | 0 | 0 | 0 | 0 | 3 | 10 | 51 |
| Grand Rapids, MI | 17 | 15 | 8 | 1 | 0 | 0 | 0 | 0 | 0 | 0 | 2 | 10 | 53 |
| Traverse City, MI | 19 | 17 | 12 | 1 | 0 | 0 | 0 | 0 | 0 | 0 | 2 | 12 | 63 |
| New York, NY | 21 | 18 | 11 | 1 | 0 | 0 | 0 | 0 | 0 | 0 | 4 | 14 | 69 |
The city with the most cold days, New York, is in the strong-growth category. Both Boulder and New York have far more cold days per year than the other two strong growth cities: Pheonix and Dallas; which makes the correlation seem dubious. All three of our also rans (Ann Arbor, Grand Rapids, and Minneapolis) sit in the range between the two cold winners (Boulder & New York).
 |
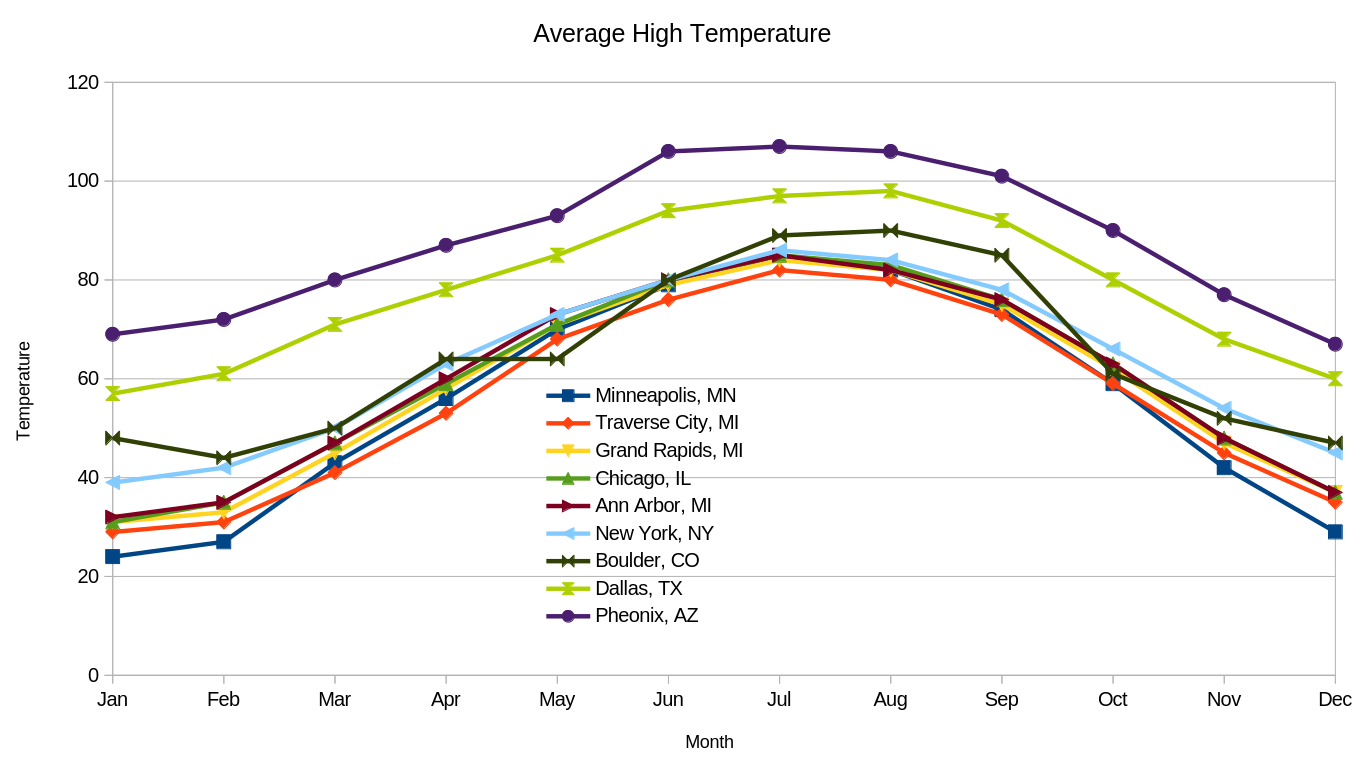
Average Daily High Temperatures
| City | Jan | Feb | Mar | Apr | May | Jun | Jul | Aug | Sep | Oct | Nov | Dec |
|---|---|---|---|---|---|---|---|---|---|---|---|---|
| Minneapolis, MN | 24 | 27 | 43 | 56 | 70 | 79 | 85 | 82 | 74 | 59 | 42 | 29 |
| Traverse City, MI | 29 | 31 | 41 | 53 | 68 | 76 | 82 | 80 | 73 | 59 | 45 | 35 |
| Grand Rapids, MI | 31 | 33 | 45 | 58 | 71 | 79 | 84 | 82 | 75 | 62 | 47 | 37 |
| Chicago, IL | 31 | 35 | 47 | 59 | 71 | 80 | 85 | 83 | 76 | 63 | 48 | 37 |
| Ann Arbor, MI | 32 | 35 | 47 | 60 | 73 | 80 | 85 | 82 | 76 | 63 | 48 | 37 |
| New York, NY | 39 | 42 | 50 | 63 | 73 | 80 | 86 | 84 | 78 | 66 | 54 | 45 |
| Boulder, CO | 48 | 44 | 50 | 64 | 64 | 80 | 89 | 90 | 85 | 61 | 52 | 47 |
| Dallas, TX | 57 | 61 | 71 | 78 | 85 | 94 | 97 | 98 | 92 | 80 | 68 | 60 |
| Pheonix, AZ | 69 | 72 | 80 | 87 | 93 | 106 | 107 | 106 | 101 | 90 | 77 | 67 |
The average high daily temperate data is interesting: Grand Rapids has one (1), and only one (1), month where the average daily high temperature is below freezing. That is January. This explains the intermittent experience of winter in recent years. And that one average below freezing high temperature is 31F, one (1) lonely degree below freezing. Minneapolis with two more below freezing months (3) than Grand Rapids (1) yet solidly beats Grand Rapids; population growth by ~6%.
 |
In Conclusion
Looking at the graphs of high average temperature, low average temperatures, and average number of cold days it is surprising the degree to which most of the cities are clustered together. In the related article "The Midwest Climate Critique Is Bogus" Mr. Saunders documents the same similarity in climate across all the central cities: Indianapolis and New York, St. Loius and Washington DC, Chicago, and Boston. All low-growth high-growth city pairs each with very similar climatic environments.
I am not saying that nobody moves from X to Y city because of climate. Of course someone does. But the correlation does not hold generally when other factors are backed out [particularly annexation]. People move between cities for a variety of motivations, and likely most people make a move across regions when multiple motivations compound upon each other. One correlation, revealed by the pattern of annexation, is that geographically large cities have an advantage in terms of raw population growth (Pheonix, AZ is 518sq/mi). Sprawl is initially inexpensive and Americans know how to build it. In order for space constrained cities to grow they must, at some point, change what they build; a process which inevitably involves some trauma where previously existing housing types must be destroyed. By failing to accommodate growth a city has made a decision. This was the decision made by Grand Rapids with the 2000 Master Plan which had the goal of bringing the glories of the suburbs to the city: abundant parking, large lots (encouraging double lots), and single unit detached housing. The growth which Grand Rapids has recently experienced was against the headwinds of its own planning regime.
Much harder to pin down is the impact of both economic opportunity and amenities. Cities like Boulder, CO and Minneapolis, MN - and their surrounding regions - have taken infrastructure such as public transportation seriously . . . whereas Grand Rapids has the misfortune of being in Michigan where even the Democrats who represent the urban areas don't understand there is no such thing as "high-speed light rail" (gubernatorial candidate Jocelyn Benson) or believe that rail is a "legacy" solution (Gov. Gretchen Whitmer). Certainly the job markets of larger cities are wider and more varied, something of particular importance to double income households. On the upside - despite legitimate misgivings regarding the priorities revealed by the investment choices - Grand Rapids will soon have not only an indoor arena and convention center, but also a large amphitheater and outdoor stadium; that is worth something. Our airport is the recipient of significant public largess, an investment also worth more than nothing, even as it also does not provide direct value to 90% of the city's own citizens.
In the end my take away is the same as Sarah Connor's: "there is no fate but what we make". Midwest cities are not fated by climate, cities in very similar climates demonstrate the path to growth: be a great place for the people who live there.
Related Articles & Sites
- The Midwest Climate Critique Is Bogus, Corner Side Yard 2025-06-26
- Current Results (Weather and science facts)
- The Catastrophic Blizzards of Winter 1977-78: An Analysis, Youtube
- The Limits of Sprawl, Paul Krugman 2025-07-28
- Population Decline Marks a Turning Point for Atlanta, CRE 2025-07-22
- Brookhaven tops metro Atlanta's priciest rentals as metro-wide rates fall, FOX5 (Atlanta)