Data Point: zORI In 2024 (Midwest)
2015 - 2024
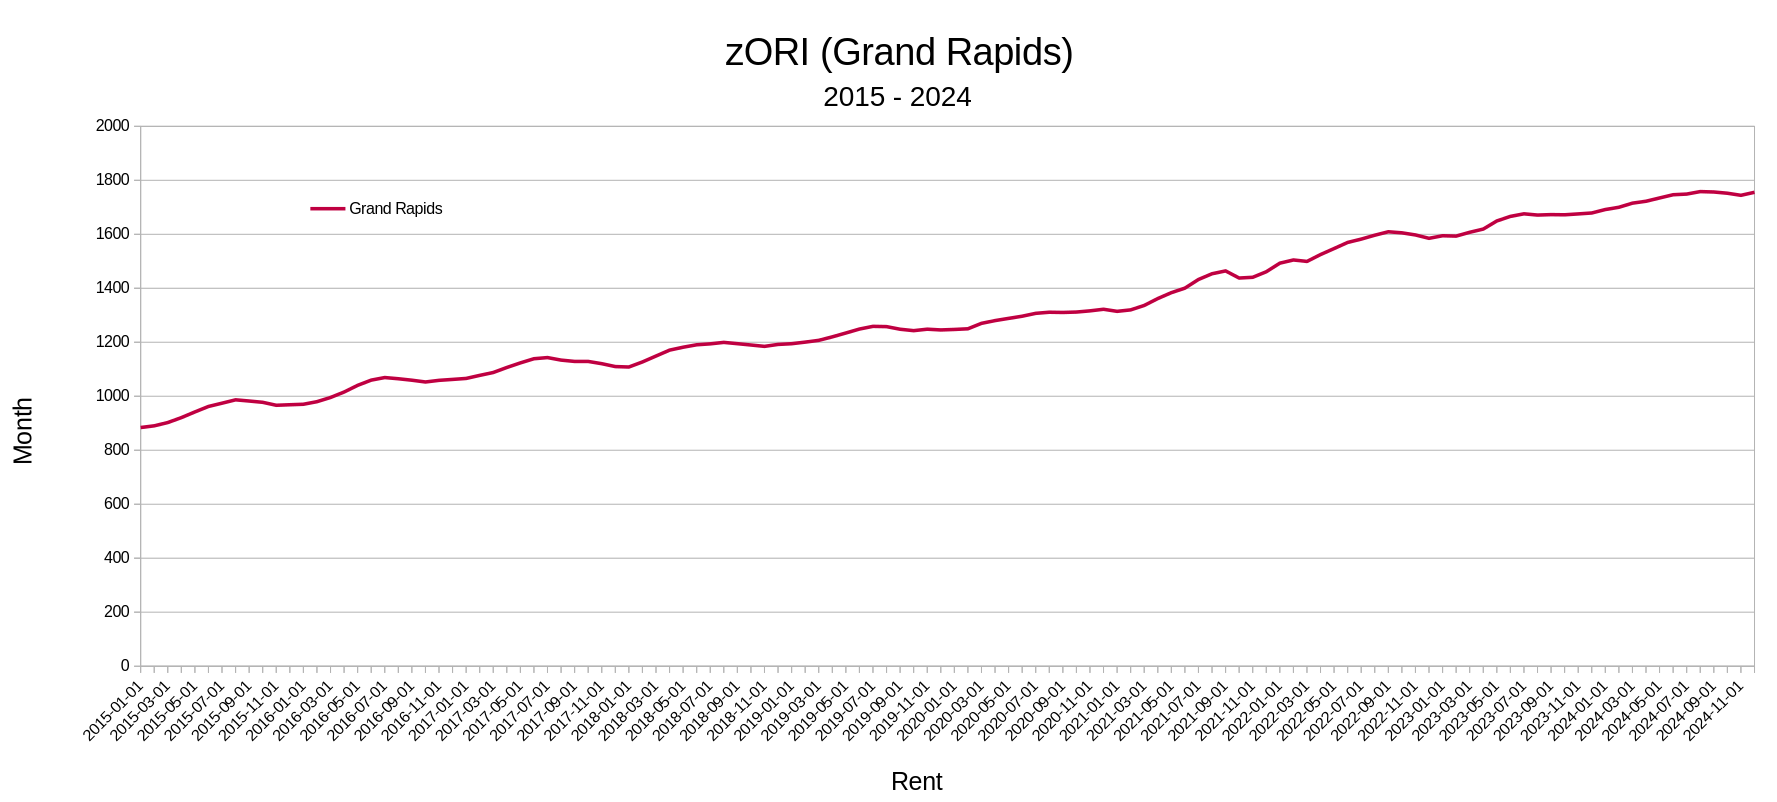
How as Grand Rapids' rent changed in the last ten years?
| Value | 2015 | 2016 | 2017 | 2018 | 2019 | 2020 | 2021 | 2022 | 2023 | 2024 |
|---|---|---|---|---|---|---|---|---|---|---|
| Change/yr $ | +$84 | +$92 | +$44 | +$84 | +$51 | +$75 | +$147 | +$92 | +$84 | +$64 |
| Change/yr % | +9.5% | +9.5% | +4.1% | +7.5% | +4.3% | +6.0% | +11.2% | +6.2% | +5.3% | +3.8% |
| CPI Adjusted $ | +$111 | +$120 | +$56 | +$104 | +$62 | +$90 | +$170 | +$98 | +$84 | +$64 |
A total increase of $817/mo! Adjusted for inflation that is $959/mo in spending power*. The zORI for December 2024 was $1,755/mo, compared to $884/mo in January of 2015; a 98% increase over the ten years.
It is interesting that the greatest increase in rent occurred in 2021, still a "pandemic year", during the "everyone is fleeing the city to the suburbs" era of op-ed journalism. That narrative was never true - aside from being mathematically, spatially, impossible - and serves to highlight the chasm which can exist between data [aka: truth] and what is happening in the cultural narrative [not reality].
*Note: Inflation rates include the pricing of housing, so there is some double-dipping occurring in the CPI Adjusted numbers and the $959 total. Housing may be the most inflationary component of the inflation rate calculation. However, it remains a fact that a 2015 dollar is not a 1:1 comparison in spending power to a 2024 dollar.
Annual Increase ($)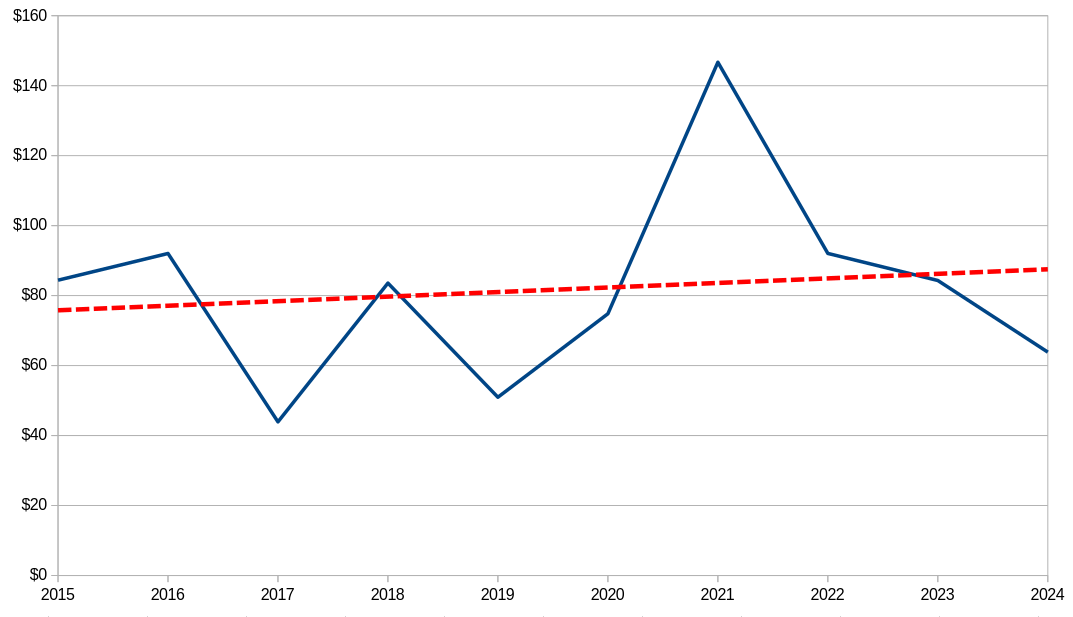 |
Annual Increase (%)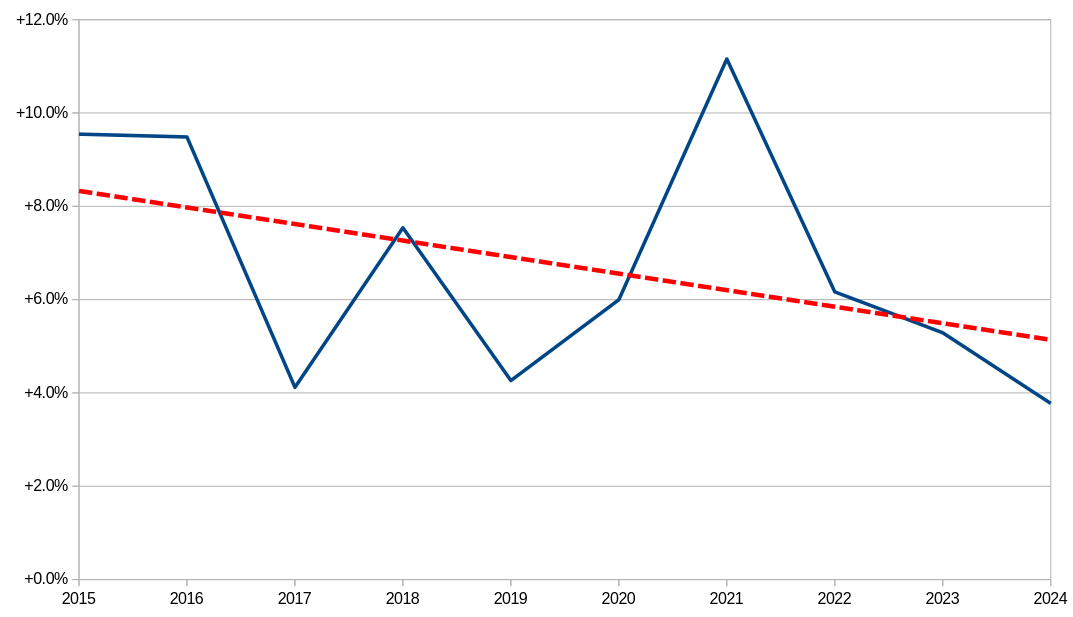 |
What is the zORI? It is the Zillow Observed Rent Index. A smoothed measure of the typical observed market rate rent across a given region. ZORI is a repeat-rent index that is weighted to the rental housing stock to ensure representativeness across the entire market, not just those homes currently listed for-rent. The index is dollar-denominated by computing the mean of listed rents that fall into the 35th to 65th percentile range for all homes and apartments in a given region, which is weighted to reflect the rental housing stock. You can find the details of the methodology 👉here👈,
2024
Zooming in on 2024, comparing Grand Rapids to a collection of other midwest cities:
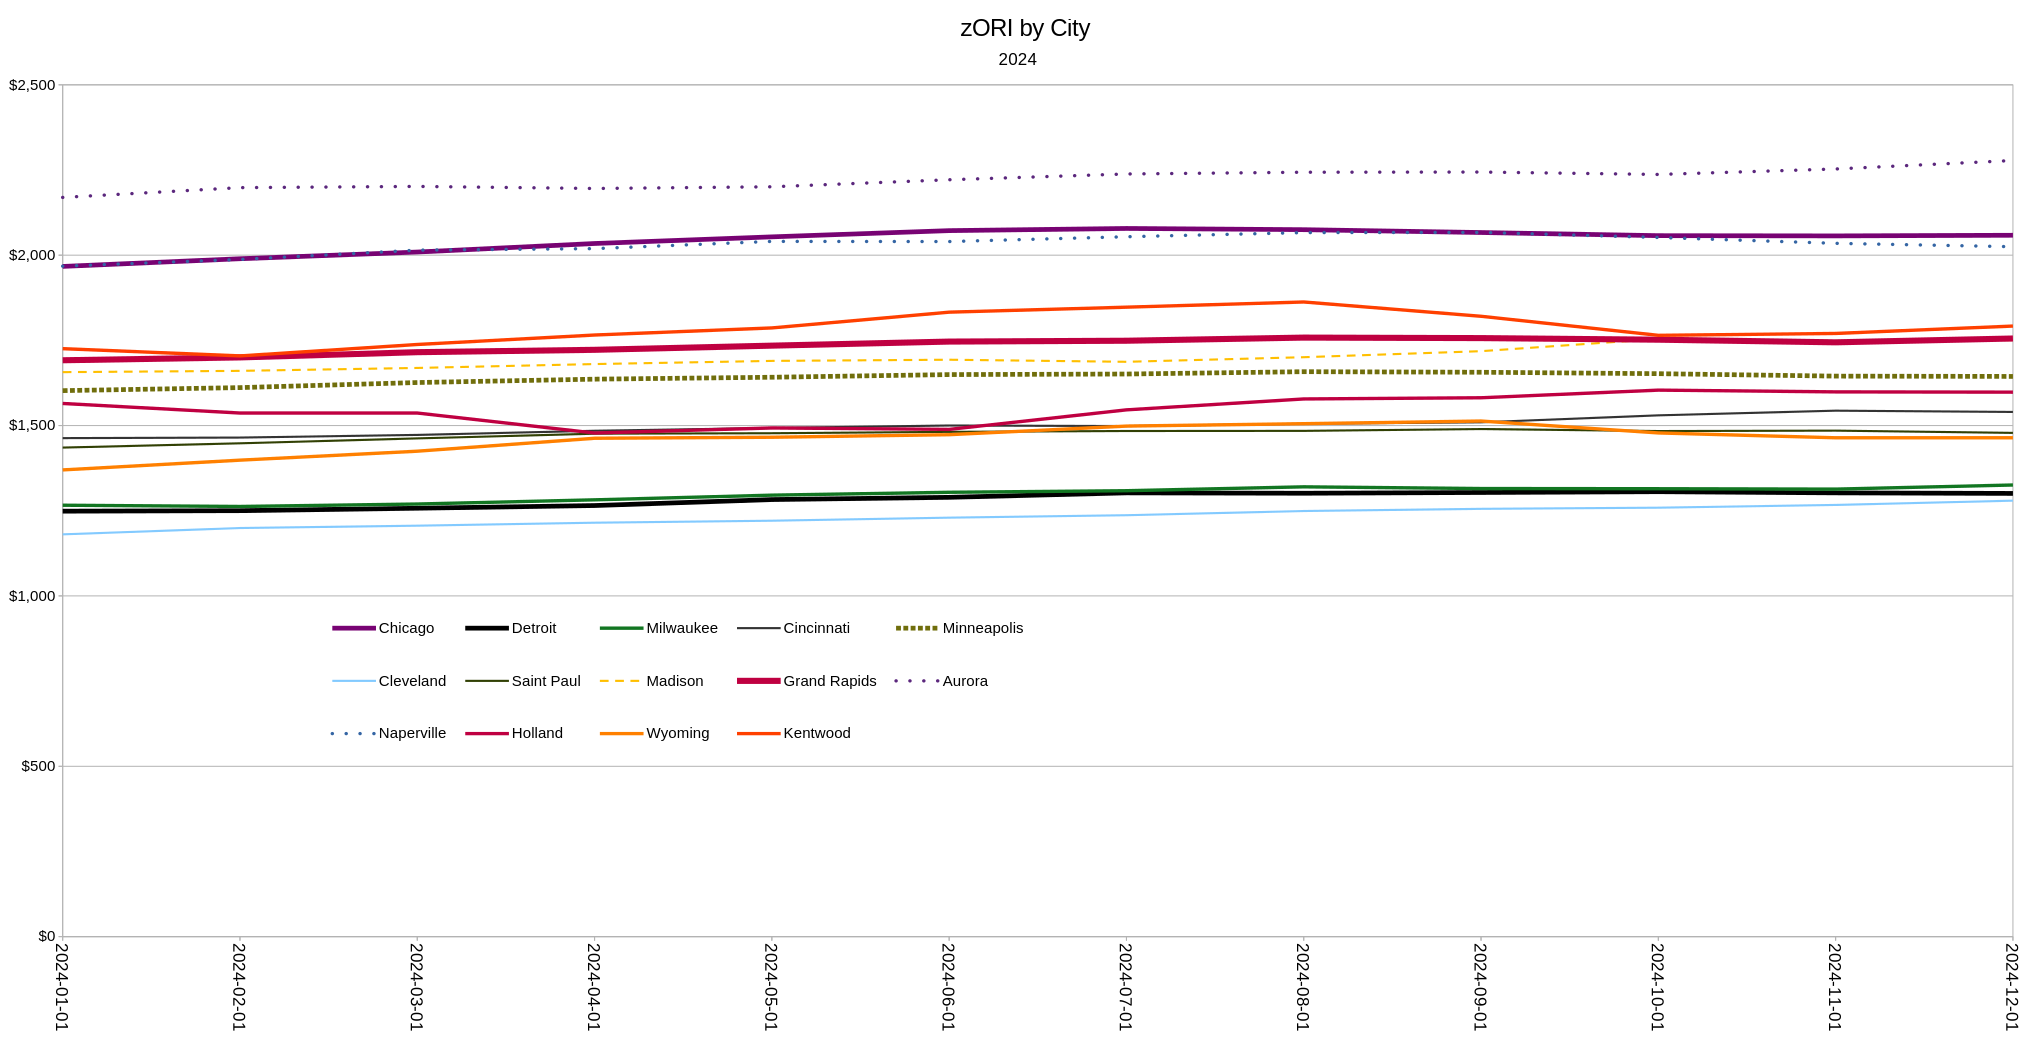
It is always important to have comparative values for metrics. From Chicago, the undisputed capital of the Midwest, two of its suburbs - Aurora and Naperville - both linked to the center city by the same rail line, to Detroit - the poorest of the Midwest cities - to Minneapolis the near ideal of a well run city in a well run state (Minnesota).
| City | 2024-01-31 | 2024-12-31 | Change | % Change | % Rank | Population | Rank (Population) | Density | Rank (Density) | AMI | Rank (AMI) | Rent/AMI | Rank (Rent/AMI) |
|---|---|---|---|---|---|---|---|---|---|---|---|---|---|
| Chicago | $1,967 | $2,058 | +$91 | +4.6% | 7 | 2,664,454 | 1 | 11,699 | 1 | $74,474 | 4 | 33% | 4 |
| Detroit | $1,249 | $1,301 | +$52 | +4.2% | 8 | 633,221 | 2 | 4,564 | 6 | $38,080 | 14 | 41% | 1 |
| Milwaukee | $1,266 | $1,326 | +$59 | +4.7% | 6 | 561,369 | 3 | 5,837 | 4 | $52,992 | 12 | 30% | 6 |
| Cincinnati | $1,463 | $1,540 | +$77 | +5.3% | 4 | 311,112 | 6 | 3,993 | 8 | $54,314 | 11 | 34% | 3 |
| Minneapolis | $1,602 | $1,644 | +$42 | +2.6% | 13 | 425,142 | 4 | 7,873 | 2 | $81,001 | 3 | 24% | 11 |
| Cleveland | $1,181 | $1,280 | +$99 | +8.4% | 1 | 362,670 | 5 | 4,665 | 5 | $39,041 | 13 | 39% | 2 |
| Saint Paul | $1,435 | $1,478 | +$43 | +3.0% | 11 | 303,827 | 7 | 5,846 | 3 | $73,975 | 5 | 24% | 12 |
| Madison | $1,657 | $1,751 | +$94 | +5.7% | 3 | 280,307 | 8 | 3,374 | 11 | $70,484 | 9 | 30% | 8 |
| Grand Rapids | $1,692 | $1,755 | +$64 | +3.8% | 10 | 196,587 | 9 | 4,391 | 7 | $70,258 | 10 | 30% | 7 |
| Aurora | $2,170 | $2,278 | +$108 | +5.0% | 5 | 179,355 | 10 | 3,981 | 9 | $89,658 | 2 | 30% | 5 |
| Naperville | $1,968 | $2,025 | +$57 | +2.9% | 12 | 151,220 | 11 | 3,862 | 10 | $152,181 | 1 | 16% | 14 |
| Holland | $1,565 | $1,598 | +$33 | +2.1% | 14 | 34,266 | 14 | 2,054 | 14 | $72,905 | 8 | 26% | 10 |
| Wyoming | $1,370 | $1,464 | +$94 | +6.9% | 2 | 77,452 | 12 | 3,130 | 12 | $73,950 | 6 | 24% | 13 |
| Kentwood | $1,726 | $1,792 | +$66 | +3.8% | 9 | 54,114 | 13 | 2,587 | 13 | $73,647 | 7 | 29% | 9 |
A cursory examination of the data demonstrates how pervasive the housing crisis is. The relentless growth of rents is everywhere. This is not surprising as almost all American cities - however much Urban Planners talk about "context" and "nuance" - have effectively the same boiler-plate cut-n-paste land use policies. Those land use policies are the fence preventing different outcomes.