What Is Affordable?
UPDATE 2025-01-18: See updated (2025) housing affordability tables @ Affordability Tables 2025
Related:
Where rent is most, least affordable in Michigan, MLIVE 2023-06-24
Kent: With an average rent of $1,326, a renter would need to make at least $25.50 per hour or $53,040 annually.
What is affordable housing? What is "A"ffordable housing?
In the United States the standard for housing affordability is that the cost of housing - rent or mortgage plus utilities - not being more than 30% of the household's gross income. Households paying more than 30% of gross income for housing are considered "cost burdened". These calculations are generally made using the median income of the county; this value is referred to as the AMI (Area Median Income). When speaking about Affordable housing the government means units of housing which are restricted to some range relative to AMI. This restriction is typically a contractual obligation on the housing units in exchange for some category of subsidy the developer received in order to make the project financially feasible. "Market Rate" housing is housing available to all comers - essentially open market housing.
The contractual obligation with the government which restricts the access to those below some financial threshold may have a term; for example, 10, 20, or 30 years, after which the restriction is terminated and the housing units become market rate (open to all comers).
In 2019 the AMI of Kent County Michigan was $66,532. This means that the breakdown for a households income, relative to AMI, looks like:
| % AMI | 1 Person | 2 Person | 3 Person |
|---|---|---|---|
| 20% | $12,540 | $14,320 | $16,120 |
| 25% | $15,675 | $17,900 | $20,150 |
| 30% | $18,810 | $21,780 | $24,180 |
| 35% | $21,945 | $25,060 | $28,210 |
| 40% | $25,080 | $28,640 | $32,240 |
| 45% | $28,215 | $32,220 | $36,270 |
| 50% | $31,350 | $35,800 | $40,300 |
| 55% | $34,485 | $39,380 | $44,330 |
| 60% | $37,620 | $42,960 | $48,360 |
| 70% | $43,890 | $50,120 | $56,420 |
| 80% | $50,160 | $57,280 | $64,480 |
| 100% | $62,700 | $71,600 | $80,600 |
| 120% | $75,240 | $85,920 | $96,720 |
| 125% | $78,375 | $89,500 | $100,750 |
| 140% | $87,780 | $100,240 | $112,840 |
| 150% | $94,050 | $107,400 | $120,900 |
A household earning less than $18,810/yr would qualify to lease or purchase Affordable housing restricted to 30% AMI or lower while a household earning $50,160/yr would qualify to lease or purchase Affordable housing restricted to 80% AMI.
Rents break down by these percentage ranges as:
| % AMI | 1 Person | 2 Person | 3 Person |
|---|---|---|---|
| 20% | $313 | $358 | $403 |
| 25% | $391 | $447 | $503 |
| 30% | $470 | $537 | $604 |
| 35% | $548 | $626 | $705 |
| 40% | $627 | $716 | $806 |
| 45% | $705 | $805 | $906 |
| 50% | $783 | $895 | $1,007 |
| 55% | $862 | $984 | $1,108 |
| 60% | $940 | $1,074 | $1,209 |
| 80% | $1,254 | $1,432 | $1,612 |
| 100% | $1,567 | $1,790 | $2,015 |
| 120% | $1,881 | $2,148 | $2,418 |
| 125% | $1,959 | $2,237 | $2,518 |
| 140% | $2,194 | $2,506 | $2,821 |
| 150% | $2,351 | $2,685 | $3,022 |
The housing of a two person household earning 60% AMI is considered affordable to that household if the rent or mortgage plus utilities is less than $1,075/mo. If that household is paying more than $1,074 that household is categorized as cost-burdened.
The inclusion of utilities into the cost of housing is critical. This means that rent and mortgage payments cannot be directly compared. It also means that the rent or mortgage on older units of housing cannot be compared easily with those of new housing as new housing is nearly guaranteed to be more energy efficient - and thus cost less to heat and cool - than older housing. Housing which appears to be less expensive may in the end be more expensive than higher-end housing.
Aside: ~50,000 of housing units in Grand Rapids were built before 1959; ~30,000 of those were built before 1939.
The Grand Rapids' 2020 Housing Needs Analysis found that 52% of renters were considered cost burdened and 19% of home owners. Given that just between July 2021 and July of 2022 the observed rents in Grand Rapids increased ~$134/mo these percentages are certainly higher for renters. Decades of very low mortgage interest rates have given home owners an astounding financial advantage over renters.
More broad categories of housing affordability are frequently used, especially in relation to market-rate developments.
| % AMI | Household Gross Income | Affordable Rents |
|---|---|---|
| 0% - 30% | - $18,810 | - $470/mo |
| 30% - 540% | $18,810 - $31,350 | $470/mo - $783/mo |
| 50% - 80% | $31,350 - $50,160 | $783/mo - $1,254/mo |
| 80% - 120% | $50,160 - $75,240 | $1,254/mo - $1,881/mo |
| 120%+ | $75,240 - | $1,881/mo - |
Due to onerous and arbitrary regulations, such as Zoning Ordinances, and the high cost of physical construction many American cities, including Grand Rapids, face a gap in new housing construction for the middle ranges (50% - 120%) of market rate housing. Government subsidized housing targets those making below ~50% AMI while the for-profit market is predominately focused on the upper end of the market (120%+ AMI). In order for for-profit construction to work financially in the middle ranges requires economies of scale - larger denser development - which cities inhibit via their Zoning Ordinances. An example of such middle market housing would be The McConnell project which requires rezoning by the City Commission in order to move forward.
One critical flaw in these housing affordability metrics is what realtors always say about the value of real-estate "Location, Location, Location". While housing is the largest expense for almost all American households the second largest expense is transportation. The location of housing in large part determines what the household spends on transportation. Combining the cost of housing and transportation is referred to as "H+T". Many housing affordability experts advocate for a metric of H+T of less than 50% a households gross income. This recognizes that housing nearer employment opportunity and services, which costs more, many cost less than more distant housing once transportation is factored in. "H+T" is most often referenced in the context of larger cities with robust fixed-route rapid transit systems. Yet Grand Rapids does have a significant population of zero-car households. These numbers are from the 2015 Align study, they are zero-car households in Grand Rapids:
| Municipality | Count | % |
|---|---|---|
| Grand Rapids | 9,996 | 13.7 |
| East Grand Rapids | 79 | 1.8 |
| Kentwood | 1,788 | 9 |
| Wyoming | 2,111 | 7.6 |
| Grandville | 304 | 4.9 |
| Walker | 525 | 5.3 |
Beyond the counts of zero-car households there are low-car households: households with fewer automobiles than adults. Owning fewer vehicles can be a significant financial advantage to households. Additionally ~30% of Americans do not drive, due to age or physical limitations; housing in suburbs and exurbs presents significant challenges to 1 out of 3 Americans.
Maps
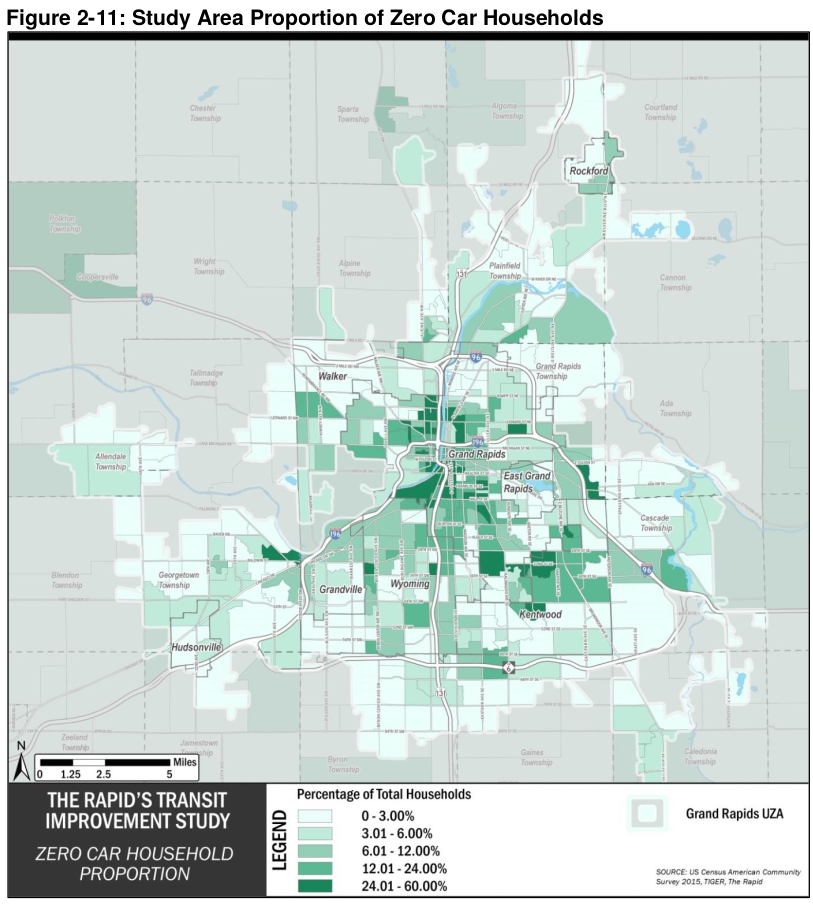
Zero Car Households
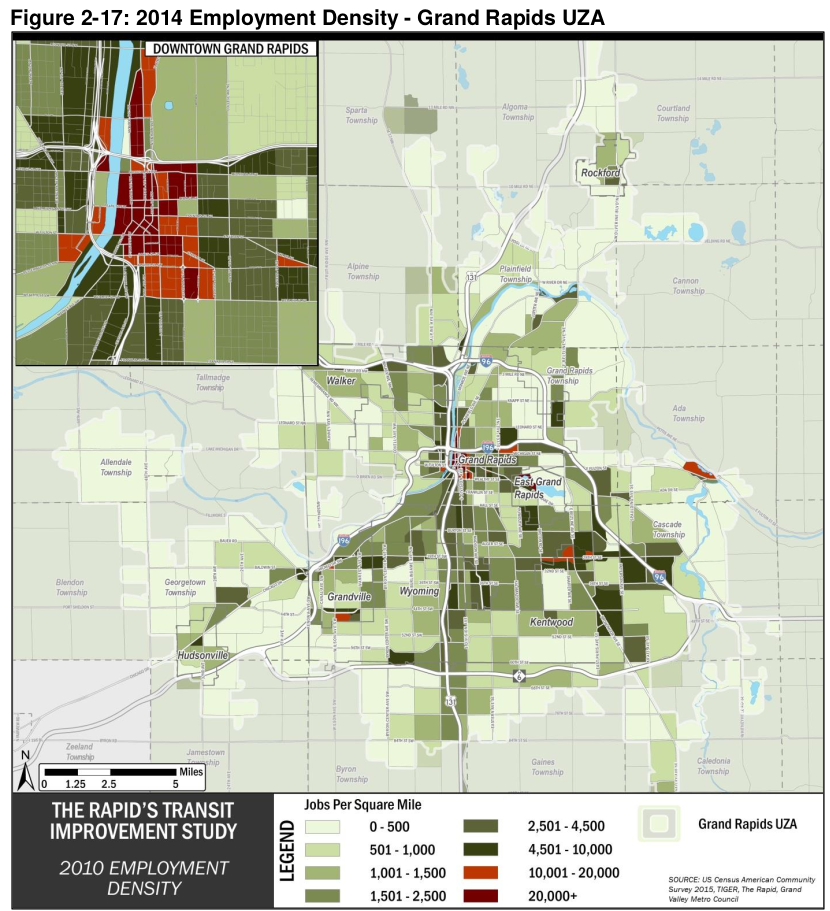
Employment Density
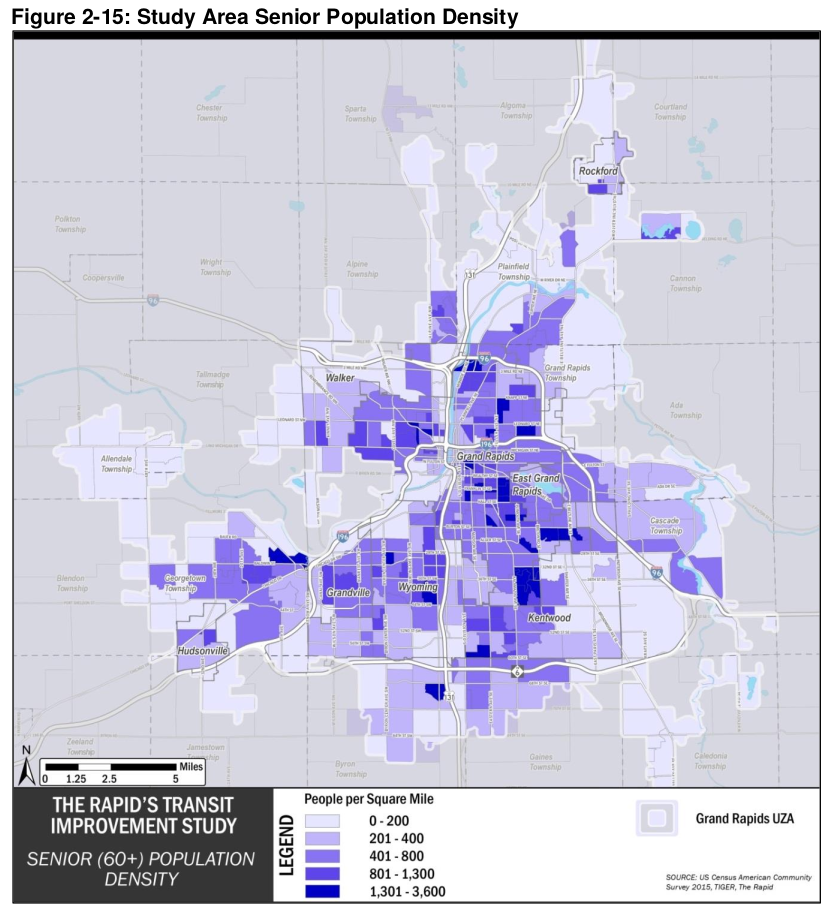
Density of Senior Residents
Related
- New Studies Provide Further Evidence That Zoning Reforms Work, Forbes, 2023-08-28