The Decline of Traffic (2025)
We’ve all heard them; the complaints about ever increasing traffic. I’ve heard it from neighbors, local activists, coworkers, and even City Commissioners.
“Once upon a time you could drive across Grand Rapids in ten minutes…”, or so the legends say.
And then there is MDOT, whose experts - despite no substantive population growth - predict the linear growth of highway traffic volumes until the day Heimdall sounds Gjallarhorn, heralding the assault upon Asgard and the final battle.
As a cyclist, pedestrian, and transit-user, this all seems odd. Early this summer while walking through downtown I experienced a moment of optimism as I looked around. There were people; and it felt to me like 2019 for the first time. The city is healing from the social and civic trauma of the COVID pandemic. The roads however, still feel empty to me. When I do drive in Grand Rapids it seems effortless and unobstructed. So, what does the data show? Something is true, and something else is not.
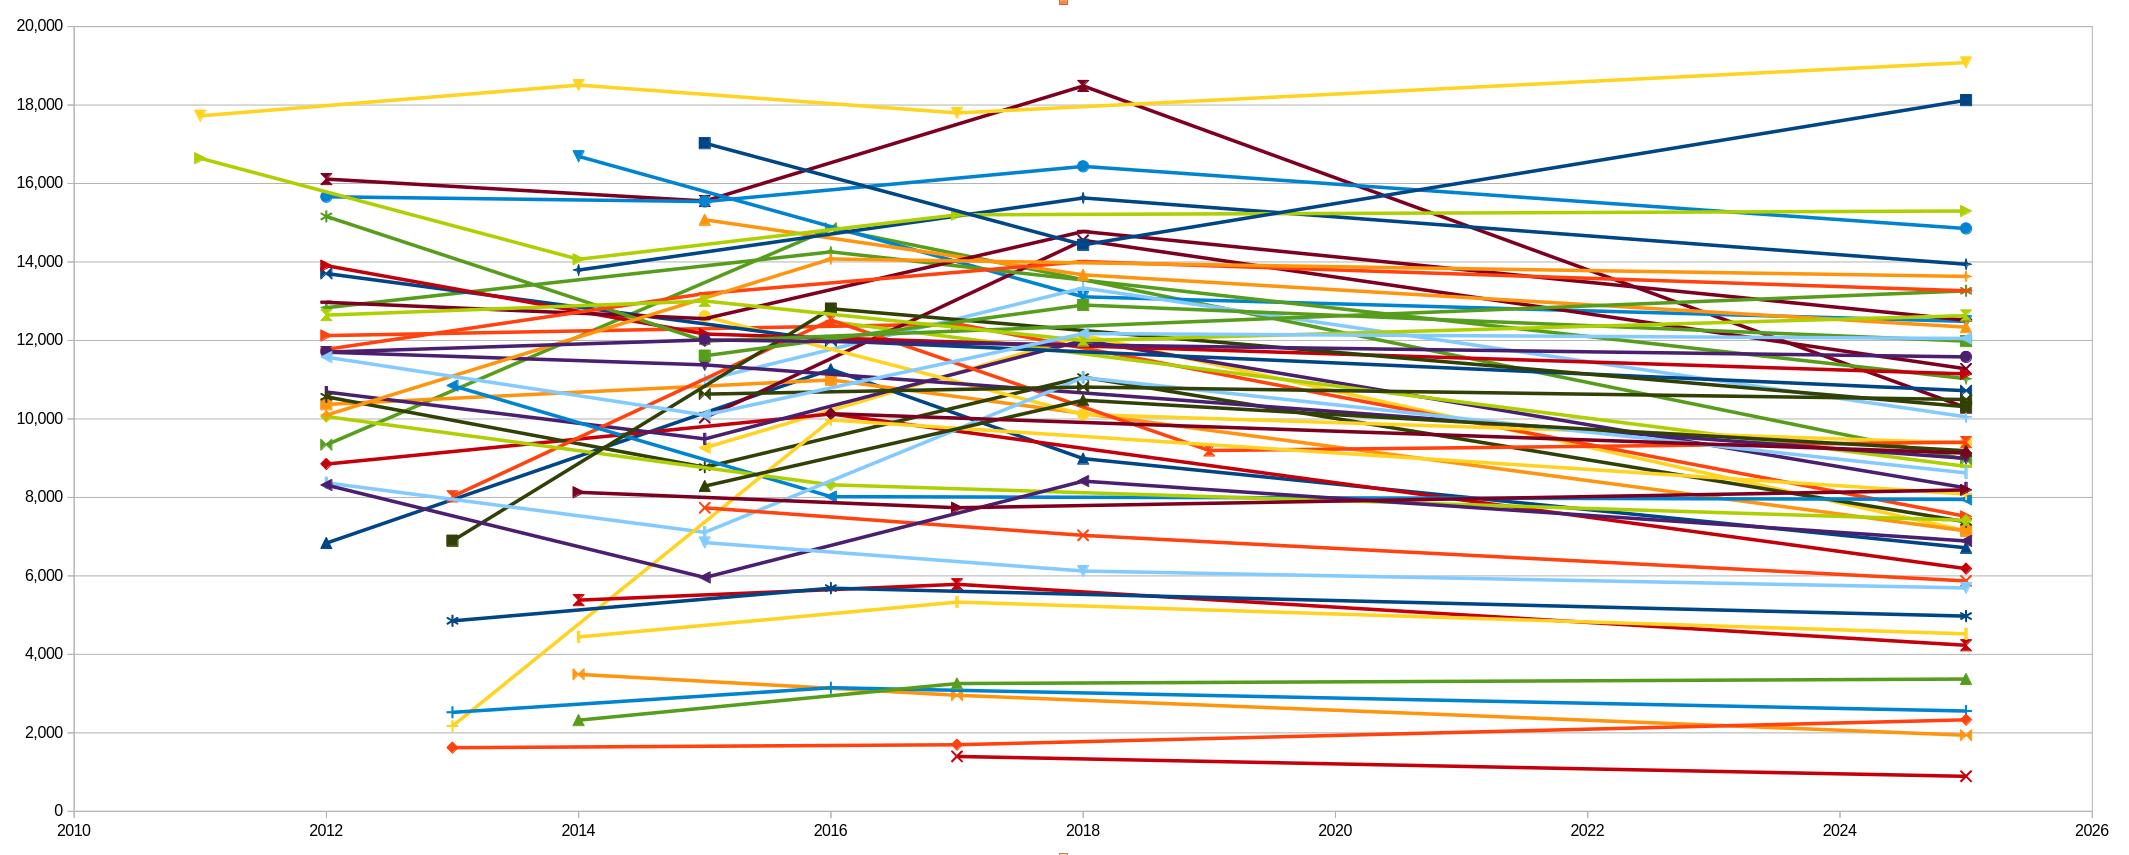
The Grand Valley Metro Council (GVMC) is the local authority and archivist of all things traffic and roads, including the AADT (Average Annual Daily Traffic). The AADT is the single biggest datapoint concerning traffic. GVMC records counts of vehicles on particular sections of roads - called, very creatively, “spots” - every few years. So far in 2025 they have recorded 2-way (both lane) traffic counts in fifty-four (54) spots across the city. By comparing these counts to previous counts (2011 - 2019) we can quantitatively answer the question: has traffic gotten worse? By which we mean - there is more of it.
The answer is a resounding “no”. Only five (5) of the fifty-four (54) spots have traffic counts higher than the highest recorded count in 2011 - 2019; that is 9% of the counted spots. Overall the median change in traffic counts is an astonishing -19%. Which certainly explains why, from a pedestrian and cyclist’s perspective, the streets feel empty. Of the majority of streets which showed a decline in traffic thirty-six (36) of those had a decline of more than 1,000 vehicles a day.

AADT for all the spots with 2-way readings in 2025.
Where did traffic increase? Traffic increased in five spots.
- Spot#2593: Leonard St west of I-96, +6%, or 1,097 more vehicles each day than the previous maximum in 2015.
- Spot#1438: Century Ave north of Hall, +37%, or 635 more vehicles each day than the previous maximum in 2017.
- Spot#1430: Breton south of Burton, +3%, or 575 more vehicles each day than the previous maximum in 2017.
- Spot#410: Jefferson Ave north of Hall St, +4%, or 114 more vehicles each day than the previous maximum in 2017
- Spot#1517: Franklin west of Fuller, +1%, or 60 more vehicles each day than the previous maximum in 2014
What five spots saw the largest decreases in vehicle counts?
- Spot#2710: Plainfield south of Leonard, -40%, or 4,548 fewer vehicles each day than the previous maximum of 16,691. The dramatic decline of this number can be attributed to the ongoing reconstruction of Division Ave, as there has been a “Road Closed” sign as far north as Coldbrook St for the entirety of 2025.
- Spot#1530: Fulton St west of Diamond, -39%, or 4,905 fewer vehicles each day than the previous maximum of 2017
- Spot#1534: Fulton St west of Cascade, -41%, or 4,981 fewer vehicles each day than the previous maximum of 2018.
- Spot#2343: Madison Ave north of 28th, -40%, or 5,891 fewer vehicles each day than the previous maximum of 2016
- Spot#2482: Fuller Ave south Fulton, -44%, or 8,198 fewer vehicles each day than the previous maximum of 2018.
These numbers - the scale and pervasiveness - was a surprise; I was expecting the numbers to show some amount of decline, yet for the most part to generally be flat. I was wrong. It raises an interesting question: where are the vehicles?
It is too easy to lean into the current narrative du’jour about work-from-home or that people are less social than prior to the pandemic. The problem with those narratives is that they are rather difficult to find in the data. There is a small decline in some of the numbers measuring activity in the city’s center [“downtown”], yet they don’t feel like they can account for the pervasive scale of decline in traffic.

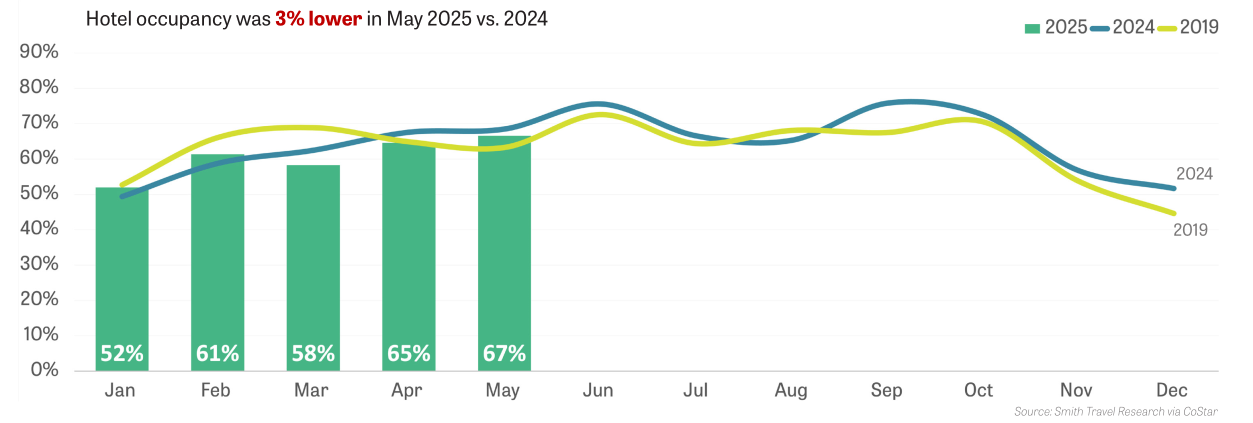
Downtown Hotel Occupancy (DGRI, July 2025); near or above 2019 counts.
Downtown Visitors (DGRI, July 2025), near 2019 counts.
Downtown Employees (DGRI, July 2025), down from 2019 levels somewhat, most months.
One flaw in the commonly held work-from-home narrative is that the shift to work-from-home favors the suburbs. The reality is that there is a roughly equal share of work-from-home employees across all communities.

Commuting Mode, including Worked-at-Home, from Housing Next 2024 report.
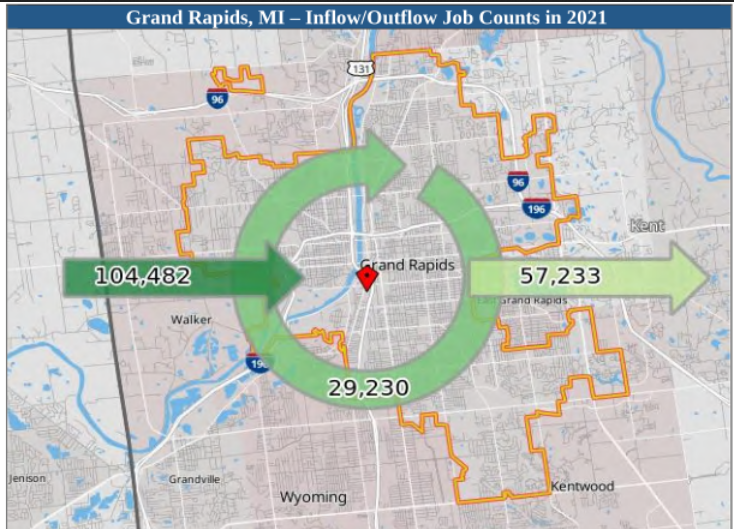
Perhaps given the number of employees who commute out of the city vs. into the city account for the decline? That number is significant. Unfortunately commuting data comes in slowly and the best data yet available still represents the pandemic era (~2021).

Commuter Flow Counts, from the Housing Next (2024) report.
Or, perhaps, Grand Rapids residents are themselves making fewer trips, spending more time within their own communities? It is fun when the data turns out to be as surprising as this. And the cause is, in actuality, likely a confluence of factors rather than a single narrative. Now it is time to pour a cold one and speculate.
P.S. In terms of roadway investments, what does declining traffic mean? Roads and streets will last longer, but lower volumes may mean higher speeds and more danger for other users.
Related
- Car Trips are Down, With Young People Leading the Charge, Planetizen 2025-09-16


