RAPID (Municpal Area Mass Transit)
UPDATE 2026-02-01: Fourth quarter 2025 ridership information is not yet available from the US-DOT. The US-DOT's website currently displays the following alert: "Portions of DOT are affected by a lapse in appropriations. Website information may be outdated, transactions may be delayed, and inquiries may not be answered until funding is restored. Please monitor this page for updates." Elections matter, in a republic The People get the government they demand, for better or worse.
The RAPID is the public transportation provider for Grand Rapids and several surrounding communities. The RAPID was created from GRATA in 2001. In the year 2001 GRATA/RAPID carried just over five million passengers. Ridership remain fairly level until 2005 when it began a steady increase and in 2014 ridership is more than twice GRATA's highest count. Not including DASH parking shuttles and other secondary routes the RAPID provides service to 1,615 stops throughout the greater Grand Rapids area.
Passenger Fair: $1.75, includes transfer to other fixed routes and BRT. DASH parking shuttles are free. A variety of passes and ride cards are available.
Trivia: The Rapid's service area is 155 square miles.
Help
The RAPID provides a travel trainer program to assist user's unfamiliar with the RAPID or use of public transit.
Ridership
The RAPID reports annual ridership based upon a fiscal year of October 1st - September 30th.
Ridership Per Month
| Year | January | February | March | April | May | June | July | August | September | October | November | December | Total (Fiscal) | Total (Calendar) |
|---|---|---|---|---|---|---|---|---|---|---|---|---|---|---|
| 2011 | 952,674 | 920,400 | 1,005,556 | 920,688 | 660,084 | 647,709 | 576,604 | 713,923 | 1,130,480 | 1,137,949 | 1,045,671 | 804,439 | 7,528,118 | 10,516,177 |
| 2012 | 1,074,431 | 1,117,127 | 1,042,216 | 964,365 | 758,156 | 725,949 | 709,087 | 847,234 | 1,209,401 | 1,376,434 | 1,135,498 | 829,276 | 10,676,447 | 11,789,174 |
| 2013 | 1,137,078 | 1,122,435 | 1,064,073 | 1,060,784 | 790,918 | 683,701 | 678,317 | 853,386 | 1,307,179 | 1,414,862 | 1,113,642 | 845,435 | 12,039,079 | 12,071,810 |
| 2014 | 1,016,907 | 1,117,405 | 1,090,486 | 1,065,375 | 792,289 | 716,465 | 726,140 | 840,672 | 1,325,588 | 1,429,006 | 1,033,679 | 893,807 | 12,065,266 | 12,047,819 |
| 2015 | 1,094,188 | 1,050,870 | 1,068,474 | 984,729 | 724,949 | 693,752 | 667,785 | 683,918 | 1,194,756 | 1,251,480 | 1,022,264 | 885,653 | 11,519,913 | 11,322,818 |
| 2016 | 963,801 | 1,082,978 | 1,041,754 | 968,126 | 702,722 | 670,774 | 573,392 | 739,381 | 1,132,379 | 1,165,547 | 1,024,367 | 811,286 | 11,034,704 | 10,876,507 |
| 2017 | 979,670 | 1,017,380 | 1,012,151 | 909,247 | 695,218 | 644,192 | 549,261 | 719,517 | 1,049,968 | 1,100,064 | 954,719 | 727,043 | 10,577,804 | 10,358,430 |
| 2018 | 927,969 | 933,373 | 921,272 | 864,911 | 683,775 | 612,116 | 567,335 | 751,190 | 1032971 | 1,147,287 | 942,128 | 730,231 | 10,076,738 | 10,114,558 |
| 2019 | 820,397 | 893,035 | 917427 | 937,439 | 710,128 | 605,927 | 630,318 | 749,735 | 1,009,075 | 1,088,772 | 894,768 | 733,370 | 10,093,127 | 9,990,391 |
| 2020 | 954,571 | 943,782 | 497509 | 112,079 | 129,598 | 240,825 | 266,449 | 268,696 | 350,143 | 370,029 | 288,873 | 239,689 | 6,480,562 | 4,662,243 |
| 2021 | 275,326 | 334,823 | 379117 | 338,709 | 270,265 | 288,209 | 287,250 | 335,124 | 513,178 | 488,900 | 458,036 | 385,352 | 3,920,592 | 4,354,289 |
| 2022 | 423,667 | 450,227 | 501531 | 455,028 | 388,201 | 366,465 | 341,183 | 420,647 | 587,539 | 573,573 | 501,321 | 418,672 | 5,266,776 | 5,428,054 |
| 2023 | 537,255 | 500,538 | 550,005 | 511,134 | 450,113 | 407,283 | 357,157 | 441,819 | 561,585 | 645,274 | 554,096 | 458,968 | 5,810,455 | 5,975,227 |
| 2024 | 509,506 | 591,029 | 546,818 | 574,944 | 475,757 | 374,856 | 364,217 | 479,044 | 650,172 | 703,844 | 578,319 | 446,854 | 6,224,681 | 6,295,360 |
| 2025 | 553,606 | 559,741 | 586,760 | 561,896 | 438,176 | 379,302 | 381,351 | 474,318 | 660,888 | 682,714 | 590,883 | - | 6,325,055 | - |
- Number is preliminary, the value has not yet been reported by the NTB.
As of 2022-01 we have switched from using ridership numbers published by the RAPID to those recorded on the NTB (National Transportation Database). The Rapid (Interurban Transit Partnership) is NTD system ID#50033; we sum directly operated (DO) modes for motor-bus (MB) and rapid-bus (RB). These numbers do not include paratransit, van pool, demand-response, and other riders. Those riders are important, but those modes and services are essentially distinct from fixed-route transit service, many other factors [and regulations] apply to both their operation and their definition of success.
Most of service as classified by the NTB are:
| Code | Description |
|---|---|
| MB DO | Fixed route service, directly operated |
| DR DO | Demand response, directly operated, this included the Rapid Connect service |
| DR PT | Paratransit; this service is currently operated by MV Transit |
| RB DO | Bus Rapid Transit, directly operated; this includes the Silver Line & Laker Line |
Ridership Changes Per Month
| Year | January | February | March | April | May | June | July | August | September | October | November | December | Total |
|---|---|---|---|---|---|---|---|---|---|---|---|---|---|
| 2012 vs 2011 | - | - | - | - | - | - | - | - | - | +455,746 | +475,414 | +181,567 | - |
| 2013 vs 2012 | +62,647 | +5,308 | +21,857 | +96,419 | +32,762 | -42,248 | -30,770 | +6,152 | +97,778 | +38,428 | -21,856 | +16,159 | +282,636 |
| 2014 vs 2013 | -120,171 | -5,030 | +26,413 | +4,591 | +1,371 | +32,764 | +47,823 | -12,714 | +18,409 | +14,144 | -79,963 | +48,372 | -23,991 |
| 2015 vs 2014 | +77,281 | -66,535 | -22,012 | -80,646 | -67,340 | -22,713 | -726,140 | -156,754 | -130,832 | -177,526 | -11,415 | -8,154 | -1,392,786 |
| 2016 vs 2015 | -130,387 | +32,108 | -26,720 | -16,603 | -22,227 | -22,978 | -94,393 | +55,463 | -62,377 | -85,933 | +2,103 | -74,367 | -371,944 |
| 2017 vs 2016 | +15,869 | -65,598 | -29,603 | -58,879 | -7,504 | -26,582 | -24,131 | -19,864 | -82,411 | -65,483 | -69,648 | -84,243 | -456,900 |
| 2018 vs 2017 | -51,701 | -84,007 | -90,879 | -44,336 | -11,443 | -32,076 | +18,074 | +31,673 | -16,997 | +47,223 | -12,591 | +3,188 | -501,066 |
| 2019 vs 2018 | -107,572 | -40,338 | -3,845 | +72,528 | +26,353 | -6,189 | +62,983 | -1,455 | -23,896 | -58,515 | -47,360 | +3,139 | +16,389 |
| 2020 vs 2019 | +134,174 | +50,747 | -419,918 | -825,360 | -580,530 | -365,102 | -363,869 | -481,039 | -658,932 | -718,743 | -605,895 | -493,681 | -3,612,565 |
| 2021 vs 2020 | -679,245 | -608,959 | -118,392 | +226,630 | +140,667 | +47,384 | +20,801 | +66,428 | +163,035 | +118,871 | +169,163 | +145,663 | -2,559,970 |
| 2022 vs 2021 | +148,341 | +115,404 | +122,414 | +116,319 | +117,936 | +78,256 | +53,933 | +85,523 | +74,361 | +84,673 | +43,285 | +33,320 | +1,346,184 |
| 2023 vs 2022 | +113,588 | +50,311 | +48,474 | +56,106 | +61,912 | +40,818 | +15,974 | +21,172 | -25,954 | +71,701 | +52,775 | +40,296 | +543,679 |
| 2024 vs 2034 | -27,749 | +90,491 | -3,187 | +63,810 | +25,644 | -32,427 | +7,060 | +37,225 | +88,587 | +58,570 | +24,223 | -12,114 | +414,226 |
| 2025 vs 2024 | +44,100 | -31,288 | +39,942 | -13,048 | -37,581 | +4,446 | +17,134 | -4,726 | +10,716 | -21,130 | +12,564 |
- Extreme weather in January 2014 accounted for a significant dip in ridership during that period; this dip can be seen in ridership data of multiple modes on nearly all systems across the nation.
- During January 2016 GVSU and GRPS were closed four days due to weather; in comparison to 2015 with only one closure.
- Ridership in January 2019 (2019-01) was significantly impacted by severe weather; schools were closed for several days in the second half of the month and employers, including Spectrum Health, operated on essential personnel only.
- DASH service was suspected during the pandemic (2020) and never resumed full operation. DASH service was replaced with "DASH v3.0" in May of 2023, without operation on Monday or Tuesday.
- Service was dramatically curtailed during the pandemic 2020 - 2021, with most service restored in the late 2021 with the "Mobility4All" schedule. In March of 2023 the Rapid operated ~86% of the operating hours it operated prior to the pandemic.
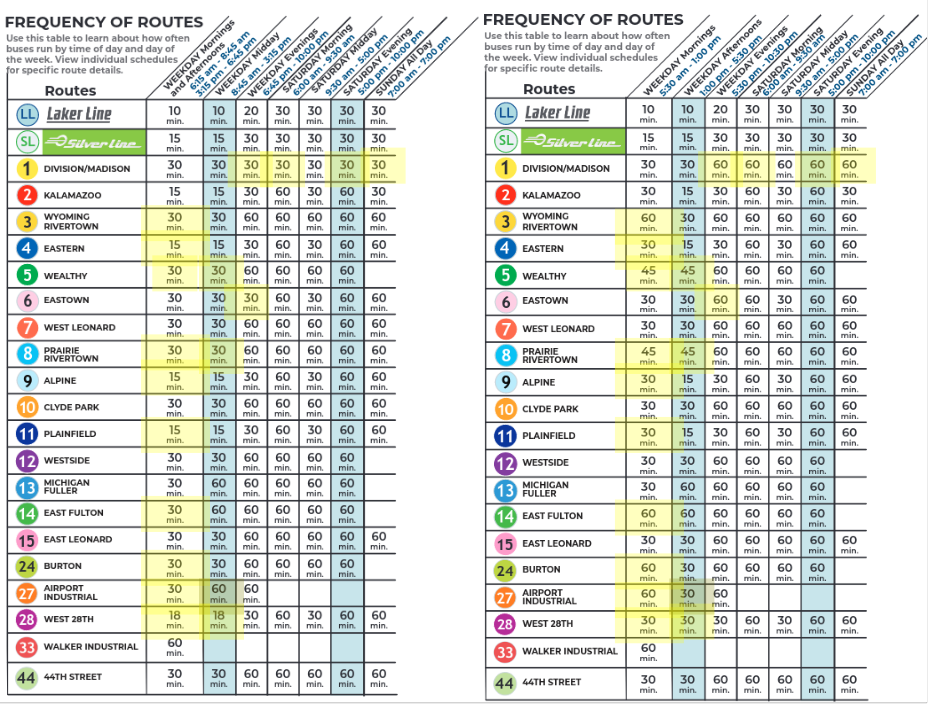
- Service was cut back, particularly during the AM weekday period, again in January of 2024 citing a lack of operators. End of 2023 vs. beginning of 2024 frequencies are illustrated here
Funding
The ITP (Interurban Transit Partnership), aka The Rapid, is primarily funded by a 1.47 mill property tax (approved in 2018) and state Local Bus Operating Assistance (LBOA or just LBO). Due the Michigan's byzantine layers of property tax regulation the 1.47 mill is functionally 1.3950 mill in fiscal year 2024-2025. Michigan has something called the "Headlee amendment" which rolls back property taxes to protect the wealthiest category of citizens from having to fund public services.
The property tax millage for funding the ITP expires 2029-12-31.
Local Bus Operating Assistance from the state of Michigan, even with the "Democratic Trifecta" is expected to decline by ~$8M for fiscal year 2024-2025 relative to fiscal year 2023-2024. See The Beginning Of The End (of The Rapid)?. 🙁
Documents
- 2010 Transit Master Plan, Final Report (PDF)
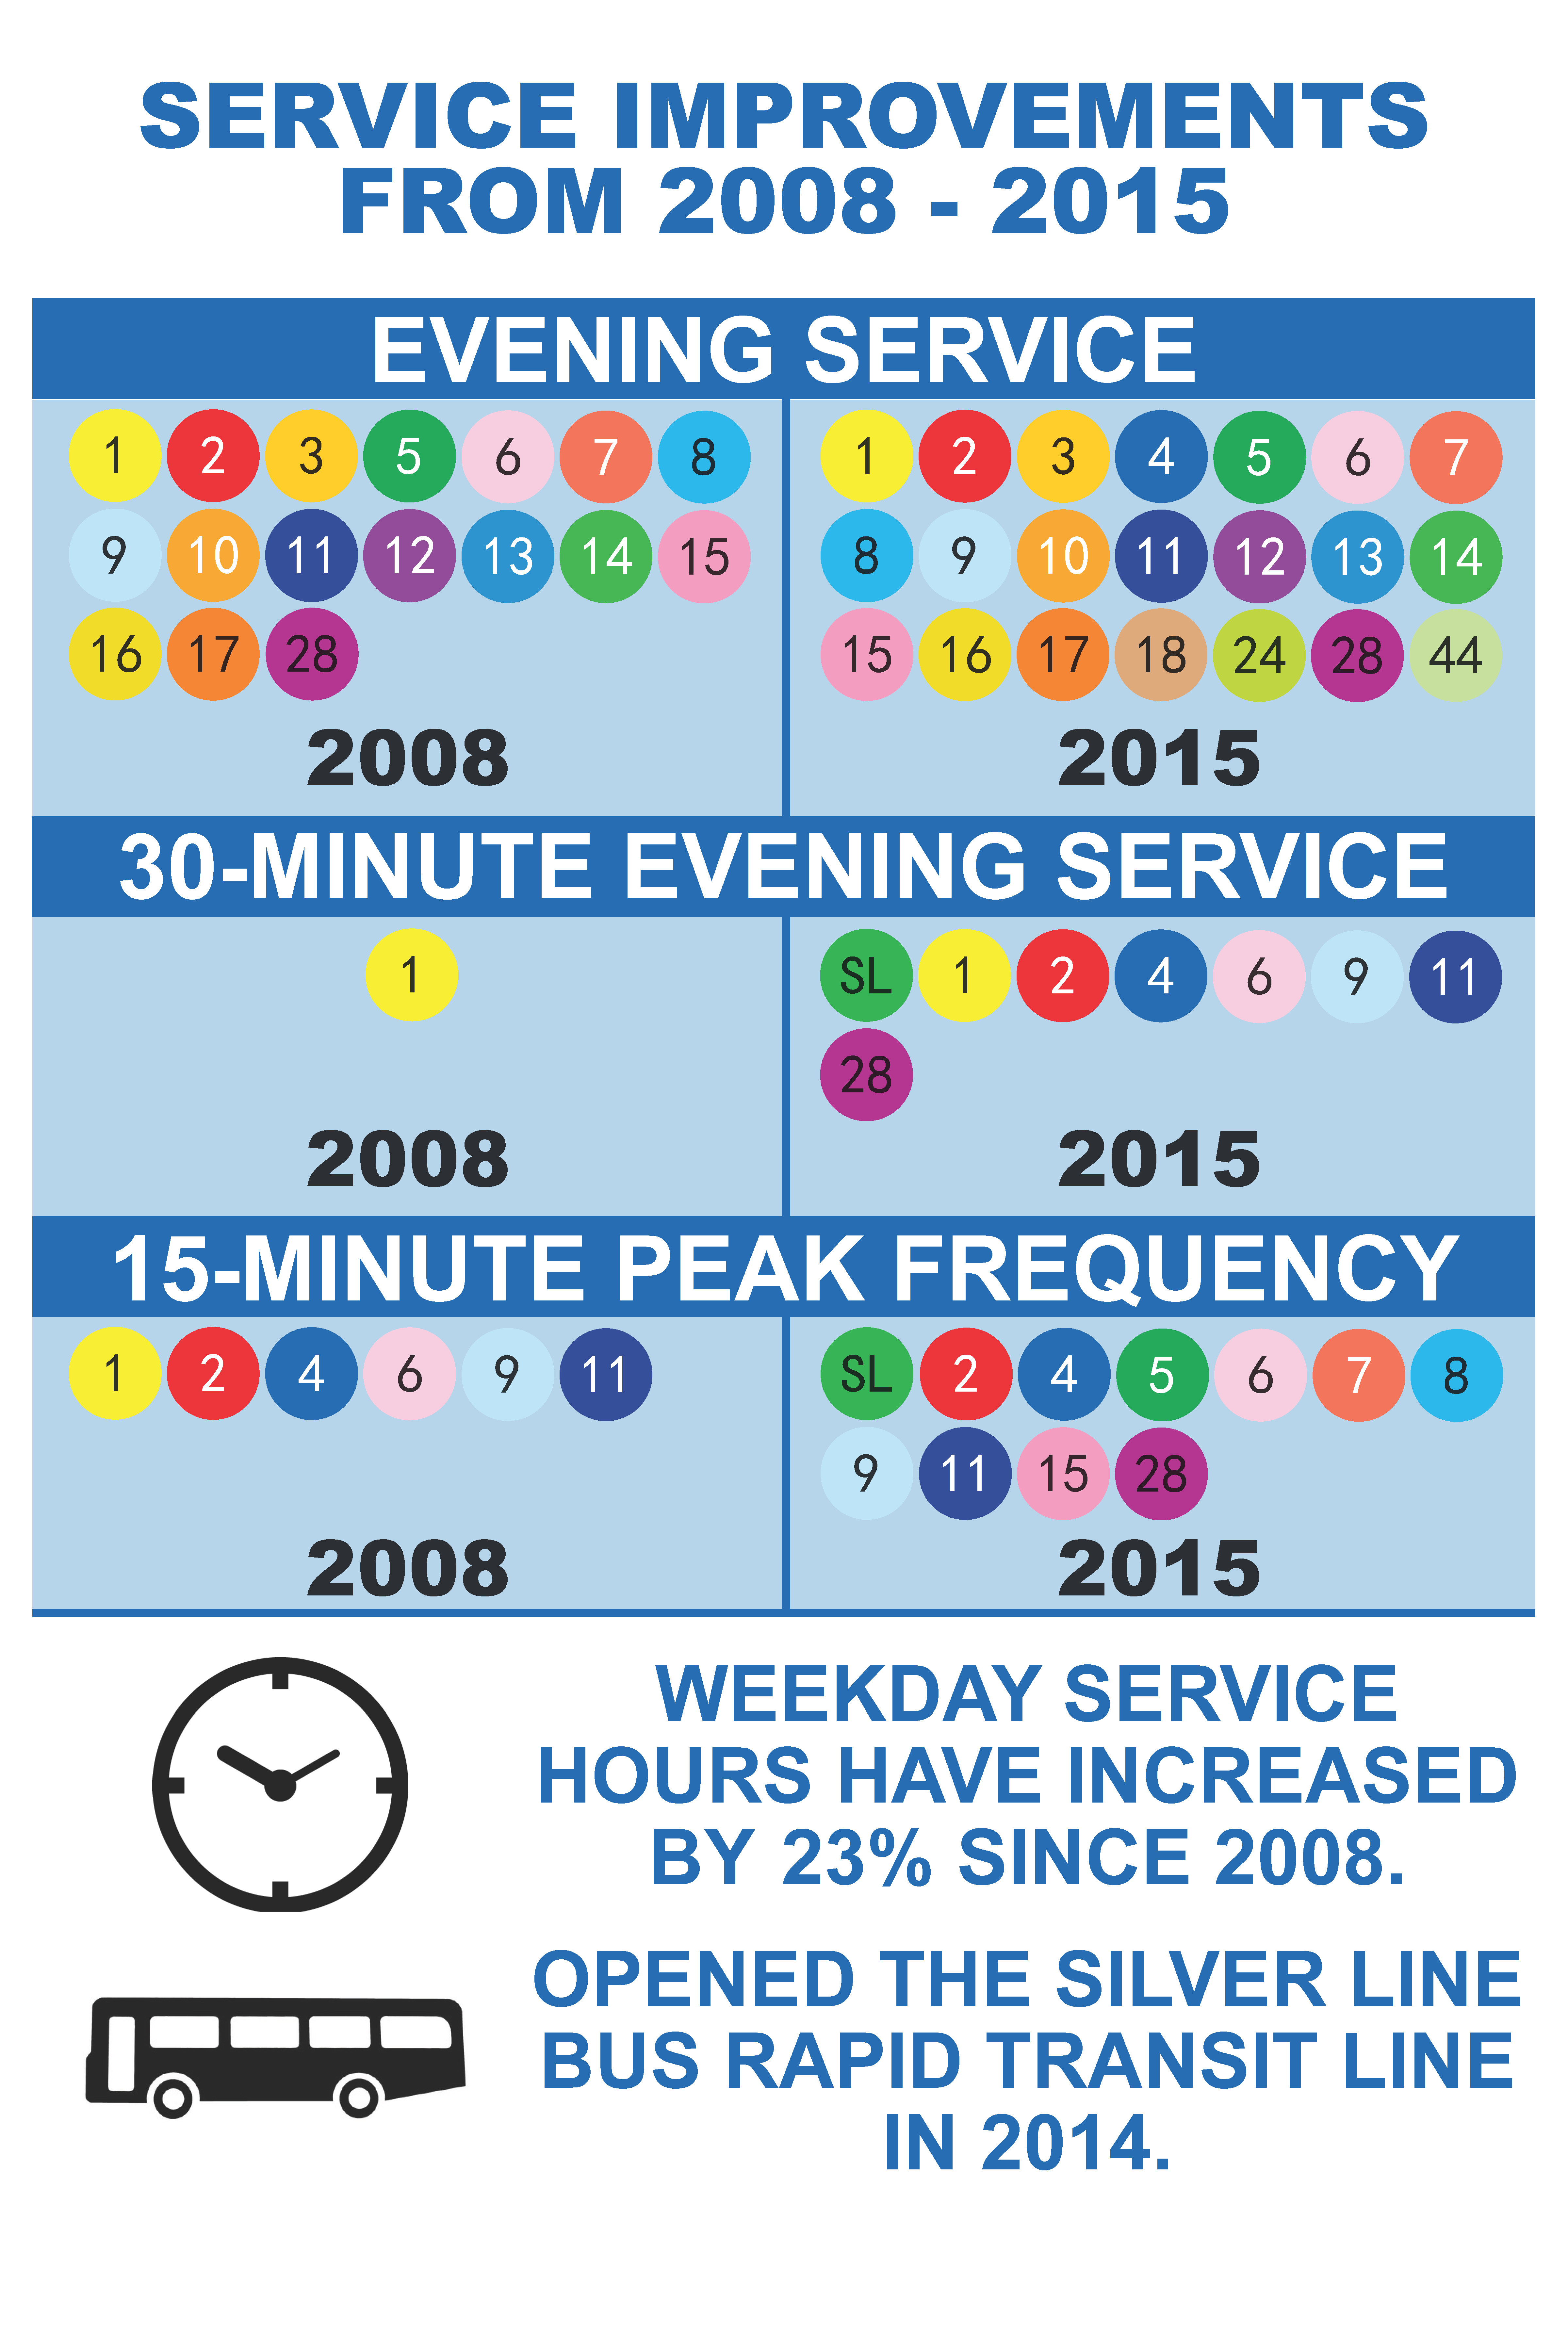
- Graphic of service improvements from 2008 to 2015 (PNG)
- State of the System Report (2019) (PDF)
- RAPID, Comprehensive Operational Analysis (COA) Proposed [2020-10-13]
- Board of Directors Materials page of The Rapid.
- Airport Access Study documents, 2023-02
- ITP/Rapid Document Archive, UrbanGR
Master Plan (2025)
These are the documents comprising the 2023-2025 Transit Master Plan.
- Final Report
- Public Engagement Strategy
- Existing & Future Conditions
- Market Analysis
- Peer Review
- Intercounty Corridor Analysis
- WMX Feasibility Study
- WMX Implementation Plan
- Fleet, Facilities, and IT Strategy
- Joint Development
News
The Rapid's "Get On Board" BLOG has been shutdown, those links are now broken.
Service Changes Coming on August 31, 2015, Get On Board, 2015-08Comments Still Being Accepted for Proposed Fare Structure Change, Get On Board, 2015-08- Removal of Four Pairs of Bus Stops on Route 4, 2015-10
- "Four pairs of bus stops on Route 4 are being removed in a stop dense area to improve schedule adherence along the route."
- New businesses, YMCA, driving request to extend bus service in Cascade Township, MLIVE, 2015-10
- "The Rapid will extend its 28th Street route into Cascade Township beginning as soon as the first of the year."
Route 28 Will Extend to Cascade Township, The RAPID's BLOG, 2015-10The Rapid wins American Public Transportation honors for Creative Excellence, The RAPID's BLOG, 2015-10- The Rapid reports increased services, success for Silver Line](http://www.therapidian.org/rapid-reports-increased-services-success-silver-line), Rapidian, 2015-12
Upcoming Routes & Service Changes: Mark Your Calendars for May 9, 2016, RAPID BLOG, 2016-04Notice of Public Hearings: Adjustment in Weekday Peak Service, RAPID BLOG, 2016-05- 20 years after countywide bus service lost by 1 vote, is it time to reconsider?, MLIVE, 2016-06
- Who rides the bus, where they go, MLIVE, 2016-06
- 80% of RAPID riders do not have their own car; 48% of SilverLine riders have their own car
- Typical rider uses the bus five times a week.
- 26% of riders ride the bus to college
- 70% of riders take the bus to work several times a week or more. On the SilverLine 79% of riders take the bus to work several times a week or more.
- 47% of riders are White, 37% are Black, 13% are Hispanic or Latino
- 58% of riders use the bus to go shopping at least once a week; 42% for SilverLine riders.
- 25% of riders use the bus to get to medical services at least once a month.
- More than 50% use the bus to go to social, religious, or personal events.
- 5 years after nail-biter bus tax vote, are you ready for another?, MLIVE, 2016-06
- How many hundred thousand bus rides The Rapid is down since 16-percent fare hike, MLIVE, 2016-06
DASH AND SILVER LINE ENHANCE ROUTES TO BETTER SERVE CUSTOMERS, RAPID BLOG, 2016-06Wheels to Work program is rolled out in Walker, GRBJ, 2016-07
While The Rapid operates in Walker, its service route does not extend down the Three Mile corridor, where many manufacturing facilities are located. “The industrial corridor in Walker has continued to grow and expand jobs, and without public transit in that area, it’s been a problem,” said Walker Mayor Mark Huizenga. “The Rapid is conducting a viability study right now, but it will take some time. This project doesn’t replace it; it fills in the gap.”- DASH consolidates routes to step up frequency of runs, GRBJ, 2016-08
Route & Service Changes Coming on Aug. 29, 2016, RAPID BLOG, 2016-08AN AFTERNOON AT RAPID CENTRAL STATION, RAPID BLOG, 2016-08- More than 9,000 people travel through Grand Rapids Central Station on an average day.
Changes Coming to DASH Shuttle Service & Silver Line on Sept. 1, 2016, RAPID BLOG, 2016-08- Parking rate spike hits this week, Silver Line bus rides free, MLIVE, 2016-08
How downtown rate hike impacts these 4 kinds of parkers, MLIVE, 2016-08
The lowest monthly parking price in city facilities currently is $27, but that will bump to $48 in order to get more expensive than the cost of a 31-day Rapid bus pass.Grand Rapids making transit and parking changes, FOX17, 2016-08
- Bus fares cheaper for Grand Rapids commuters to Ferris State, MLIVE, 2017-05
- Catch The Wave and ride The Rapid: a faster, easier and more convenient way to ride, RapidGrowth, 2017-07
You’re Invited: The Rapid & Mobile GR Unveil Largest Fleet of CNG buses in Michigan, RAPID BLOG, 2017-07Introducing The Wave: The Rapid’s New E-Fare System, RAPID BLOG, 2017-07- Grand Rapids aims for state's largest fleet of green buses, MLIVE, 2017-07
The Rapid and City of Grand Rapids rolling out Michigan’s largest fleet of CNG buses, RAPID BLOG, 2017-07The Silver Line: More than a Name, 2017-10- The RAPID is considering selling the naming rights of the Silver Line, a common practice for transit agencies.
- Rapid bus tax passes despite union contract dispute, MLIVE, 2017-11
- 22,146 vs. 13,937 (a win by 8,209 votes, and 5 of 6 cities)
Defining Division: Transforming the future of transportation is equitable mobility, Rapid Growth Media, 2018-02-08
“If the public would like to see more service improvements in the future (e.g. increased frequency to 15 minutes on all routes, running later on weekends, etc.), this will require a ballot request to increase the property tax millage for additional funding,” says Bulthuis.Laker Line funding gets federal go-ahead, MLIVE, 2018-02-09
- DASH bus routes to get makeover as city seeks more riders, MLIVE, 2018-03-09
- CNG Fueling Station project received an #Engineering Merit Award from ACECMI, ACEC of MI, 2018-03
- Downtown DASH expanding hours, MLIVE, 2018-08
The City of Grand Rapids DASH offers expanded service hours and routes, RAPID BLOG, 2018-08- The Rapid bus service launching electronic fare system, MLIVE, 2018-08
- Riding 'The Wave': Rapid rolls out e-pay option Tuesday, WOOD TV-8, 2018-08
Say Hello To Faster, Easier Fare Payment With The Wave, RAPID BLOG, 2018-08- The Rapid's new e-fare system The Wave debuts August 14, Rapidian, 2018-08
- Rapid bus service launches free rides on Michigan Street corridor, MLIVE, 2018-08
Grand Rapids leaders celebrate kickoff of fare-free Route 19 bus service along Michigan Street, RAPID BLOG, 2018-08- First look at driverless shuttle coming to Grand Rapids in 2019, MLIVE, 2018-09
- Grand Rapids rolling out autonomous shuttles, GRBJ, 2018-09
$696,000 federal grant to help spur economic development along The Rapid’s Silver Line route, RAPID BLOG, 2018-12The Rapid awarded $373,782 Michigan Mobility grant, MDOT, 2019-01
... a project called the Team Grand Rapids: Interurban Transit Partnership was awarded a $373,782 Michigan Mobility grant for utilizing a dynamic rideshare app for paratransit bus services in Grand Rapids. ... The project team consisting of The Rapid, the City of Grand Rapids, Disability Advocates of Kent County, and Via will use the grant to improve rider experience by shortening trip duration and reservation lead time. This will allow booking trips the same day and mean users spend less time on the bus.Grand Rapids bus stops getting $1.5M makeover, GRBJ, 2019-01-18
The DDA recently approved funding of $500,000 for up to 50 shelters in the downtown core. Additionally, $250,000 from The Rapid and $750,000 from Mobile GR will offer funding for improvement of up to 70 more shelters outside of downtown.The sales of paper transit passes/tickets ends on Nov. 14th, 2019
- The Rapid to implement fare payment changes Saturday, WOODTV8 2020-07-28
- Laker Line service debuts!
Grand Rapids sees renaissance of public transit, GRBJ 2020-08
Between March and August, Grand Rapids’ volume of public transportation usage increased by 158%. Across the 93 cities analyzed in the study, transit use increased by 83%, on average, in the same timeframe.- The Rapid announces service changes in Byron Township, GRBJ 2021-01
- Changes to the frequency and routing of route #1 (South Division)
New Mobilty4All schedule implemented, 2021-08-22
This includes establishing a frequent network including the six busiest routes as well as extending the #11 to the Plainfield township MeijerThe Rapid to end service in Byron Twp. after 33 years, 2022-07
- Lake Michigan Drive construction site to become part of public transportation system, MLIVE 2022-11-03
- The Rapid announces partnership with Transit App
- Contactless payment added to Wave onboard payment system, Rapid BLOB, 2023-04-23
The Rapid Offers New Connection to Michigan Turkey Producers, Rapid BLOG- Route #29 shutdown down after contract with Cascade Township expires, township BLOG, 2023-07-19
The Rapid's 2023 Community Report is available, ISSUU, 2023-08-09- The Rapid adjusts Walker route, offers faster commute to industrial district, FOX17, 2023-08-18
- The Rapid's on-time performance, fiscal year 2021 - 2023, UrbanGR, 2023-11-05
- Thirty New Four Story Buildings In Easttown?, UrbanGR 2023-11-03
- The Beginning Of The End (of The Rapid)?, UrbanGR 2023-12-21
- Presentation by the Rapid about their transit master plan to the Kent County Commission, Youtube 2024-02-08
- The county commission's response [overwhelmingly negative] is important for those whom regional or county-wide public transportation is a goal.
- The Rapid’s Transit Master Plan: What riders think, Rapidian 2024-06-25
- Ridership Recovery, UrbanGR 2024-12-10
Time-line of service changes (since 2010)
- January 2012: Extended weekday hours of operation until 11:15 or 12:15 on the busiest routes.
- January 2012: Extended Saturday operation until 10:00pm on Saturdays.
- January 2012: Regular frequency improved on busiest rounds to a minimum of every 30 minutes.
- August 2012: Six routes improved to a minimum frequency of 15 minutes during peak hours.
- August 2012: Creation of the new fixed-route RAPID#19 [weekday only] servicing Michigan St and Fuller to Hall St.
- August 2014: The launch of the SilverLine BRT.
- Fall 2014: Availability of real time stop information and integration with mobile transit applications such as TransitApp.
- January 2016: Extension of route 28 into Cascade
- May 2016: Additional trip added to RAPID#5 and RAPID#17. Additional trip on RAPID#17 is an express to the Gerald R. Ford International airport.
- September 2016:
- DASH lines consolidate to two routes with consistent hours-of-operation and 7-8 minute headways.
- SilverLine now fareless within the park-once downtown zone
- The cheapest monthly parking pass is now finally more expensive than a 31 day transit pass.
- RAPID#19 converts to a rush-hour crosstown connector on the Michigan St. corridor.
- August 2017: Routing changes to RAPID#15, RAPID#37, & RAPID#48.
- November 2018 - WAVE pilot test begins.
- June 2018: Enhanced RAPID#19 service will begin in August, 2018
- Grand Rapids Commissioners Approve new Michigan Street Corridor transportation partnership
- City, Spectrum Health to pay for free bus service on Medical Mile
- August 2018:
- WAVE electronic fare payment system goes live (Tuesday, August 14th)
- DASH gets weekend and late-night service.
- Weekday frequent & fair-free RAPID#19 Michigan St / Bridge St. Crosstown launches.
- The sales of paper transit passes/tickets ends on Nov. 14th, 2019
- Lockdown 2020 :(
- RAPID#19 (Michigan St / Bridge St crosstown) service canceled.
- Late night service on the DASH canceled.
- Numerous peak service frequencies reduced.
- Overall reduction of operating hours.
- May 2020:
- The new "summer schedule" in response to COVID19
- August 2020
- Laker Line service debuts.
- August 2021
- New Mobilty4All schedule implemented, 2021-08-22
- August 2022
- Service in Byron Center terminated.
- November 2022
- Announced: Offboard fare payment on the Silverline will be eliminated, fares will now be paid onboard the bus. This includes the installation of dwell time inducing cash fare payment machines.
- December 2022
- Partnership with Transit app, free upgrade to the Royale service level for riders.
- April 2023
- Contactless payment using debit & credit cards added to Wave payment system.
- May 2023
- Route #8 (Prairie/Rivertown) adds twice weekday extensions to serve Michigan Turkey Producers
- August 2023
- Route #29 will shutdown after contract with Cascade township expires. Route #5 extended to service the stops which were on that route within Kentwood.
- New route #33 provides an express service from central station to Walker, utilizing the US-131 expressway. Service will run every 30 minutes 5:45am - 10:45am & 1:45pm - 6:45pm beginning August 28th at 9am.
- December 2023
- Service will be cut back, particularly during the AM weekday period, beginning January 1st of 2024. End of 2023 vs. beginning of 2024 frequencies are illustrated here
- January 2024
- January 2025
- April 2025
- Fare capping changes, UrbanGR