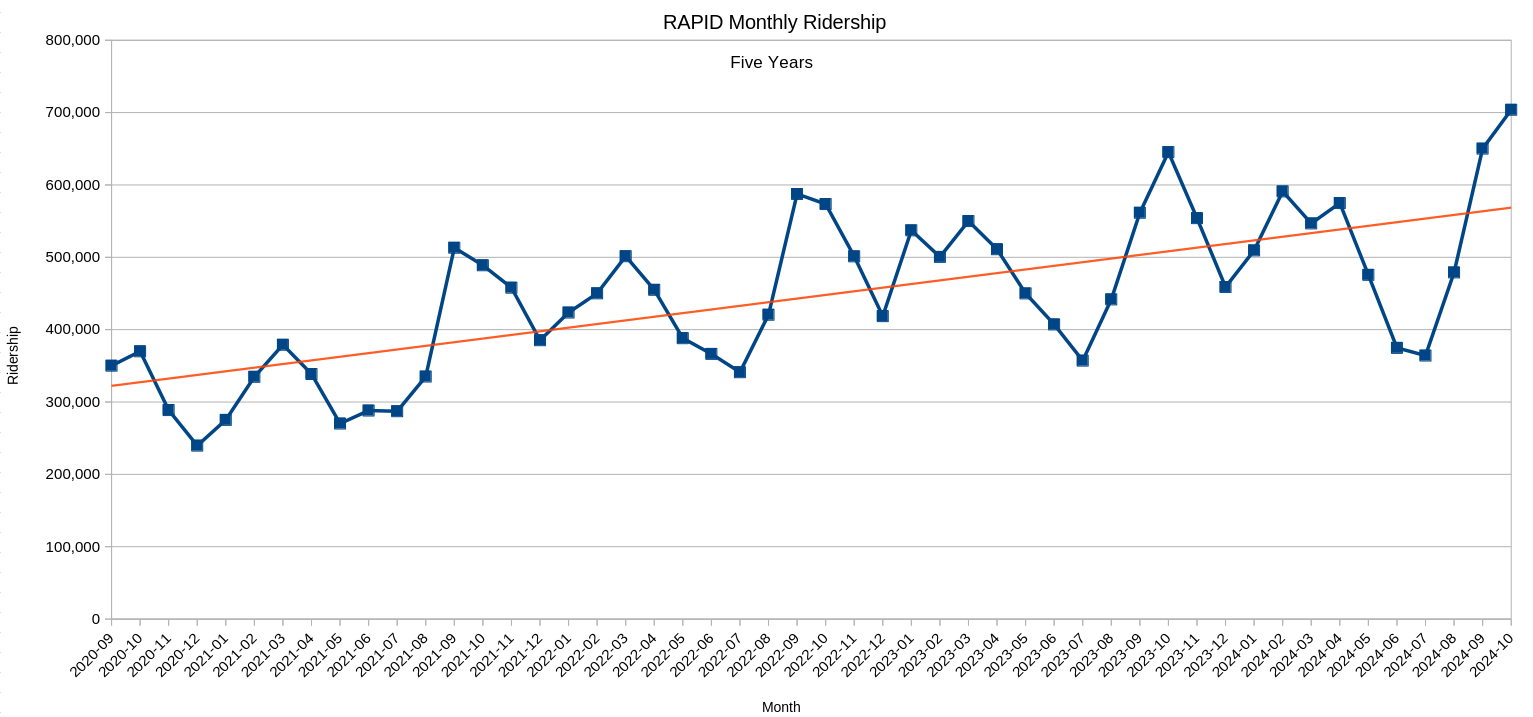
Ridership Recovery
The Rapids' ridership is showing steady "recovery"; it is deemed "recovery" as, post-COVID, everything must now be bench-marked against 2019, the last year of the before times. By the raw numbers the Rapid closed October at ~65% of 2019 ridership. That is 703,844 rides, deemed UPT or Unpaired Trips by the Federal Transportation Administration (FTA), in October 2024 compared to 1,088,772 in 2019. So far (Jan - Oct) ridership in 2024 is ~63% of comparative 2019 ridership.

On the rare occasion "main stream" media [what's left of them? MLive?] reports on these topics this is the number they would cite, before moving on to just as insightfully journalist about something else.
But these numbers are not that straight forward. A simple comparison of ridership in 2019 with 2024 does not recognize the changes in service which have occurred. In 2024 the Rapid is providing less service. With less service the expectation of equivalent ridership is not reasonable. If the bus no longer comes at the time someone needs it to, or no longer returns when they need it to, that is a lost rider.
The FTA tracks two statistics beyond ridership. There is Vehicle Revenue Miles (VRM) which is the number of miles of service which were provided, and the Vehicle Revenue Hours (VRH) which is the number of hours in total which a transportation service provider's vehicles were in operation. Relative to 2019 (Jan - Oct) the Rapid provided ~15% fewer miles of service and ~20% fewer hours of service.
| January | Febuary | March | April | May | June | July | August | September | October | |
|---|---|---|---|---|---|---|---|---|---|---|
| 2019 | ||||||||||
| UPT | 820,397 | 893,035 | 917,427 | 937,439 | 710,128 | 605,927 | 630,318 | 749,735 | 1,009,075 | 1,088,772 |
| VRM | 495,607 | 480,127 | 495,871 | 517,735 | 446,178 | 418,089 | 440,058 | 468,898 | 489,575 | 579,628 |
| VRH | 40,179 | 38,426 | 39,991 | 41,548 | 36,464 | 34,046 | 36,043 | 38,299 | 39,253 | 44,193 |
| 2024 | ||||||||||
| UPT | 509,506 | 591,029 | 546,818 | 574,944 | 475,757 | 374,856 | 364,217 | 479,044 | 650,172 | 703,844 |
| VRM | 406,731 | 419,919 | 410,511 | 431,262 | 415,992 | 366,999 | 384,384 | 420,636 | 400,573 | 450,996 |
| VRH | 30,648 | 31,406 | 30,489 | 32,009 | 31,620 | 27,875 | 29,206 | 31,967 | 30,421 | 34,284 |
| Deltas | ||||||||||
| UPT Delta | -310,891 | -302,006 | -370,609 | -362,495 | -234,371 | -231,071 | -266,101 | -270,691 | -358,903 | -384,928 |
| VRM Delta | -88,876 | -60,208 | -85,360 | -86,473 | -30,186 | -51,090 | -55,674 | -48,262 | -89,002 | -128,632 |
| VRH Delta | -9,531 | -7,020 | -9,502 | -9,539 | -4,844 | -6,171 | -6,837 | -6,332 | -8,832 | -9,909 |
| UPT Delta % | -37.90% | -33.82% | -40.40% | -38.67% | -33.00% | -38.14% | -42.22% | -36.10% | -35.57% | -35.35% |
| VRM Delta % | -17.93% | -12.54% | -17.21% | -16.70% | -6.77% | -12.22% | -12.65% | -10.29% | -18.18% | -22.19% |
| VRH Delta % | -23.72% | -18.27% | -23.76% | -22.96% | -13.28% | -18.13% | -18.97% | -16.53% | -22.50% | -22.42% |
| Scaled | ||||||||||
| 2019 UPT scaled by VRM | 673,277 | 781,048 | 759,500 | 780,866 | 662,085 | 531,883 | 550,573 | 672,567 | 825,631 | 847,150 |
| Scaled UPT Delta | -163,771 | -190,019 | -212,682 | -205,922 | -186,328 | -157,027 | -186,356 | -193,523 | -175,459 | -143,306 |
| Scaled UPT Delta % | 52.68% | 62.92% | 57.39% | 56.81% | 79.50% | 67.96% | 70.03% | 71.49% | 48.89% | 37.23% |
How much of the 384,928 fewer riders in October 2024 vs October 2019 can be attributed to service reductions? Given that the Rapid provided 22% fewer miles of service in 2024 lets remove 22% of October 2019's ridership for a comparative ridership of 847,150. This reduces the delta in ridership between 2019 and 2024 to 143,306. The reduced service may be responsible for up to as much as 37% of the ridership gap.
Now, it is obvious that a reduction in revenue hours or miles at 6:00am likely has a less impact on ridership than a reduction at 3:00pm. Much more granular data and analytics would be necessary to come up with a more precise attribution of ridership loss to service reductions. Coming up with a precise figure is not the point. The important take-away is that simple comparison of ridership year-over-year do not provide the full picture of service health or of existing demand for service. Journalists and politicians tossing about such comparisons should not be accepted as sincere participants in the conversation.
Overall the Rapid, from January to October, provided ~15% fewer miles of service than in 2019 and ~20% fewer hours of service.
| Stat | Jan - Oct, 2019 | Jan - Oct, 2024 | Delta |
| UPT | 8,362,253 | 5,270,187 | -36.98% |
| VRM | 4,831,766 | 4,108,003 | -14.98% |
| VRH | 388,442 | 309,925 | -20.21% |
How much of reduced ridership can be attributed to reduced service? That cannot be answered from the available data, but it is unreasonable to project that number as zero. It is also an excellent conversation to be had with beer.
