Mobility Update, 2025-01
The Rapid
Ridership
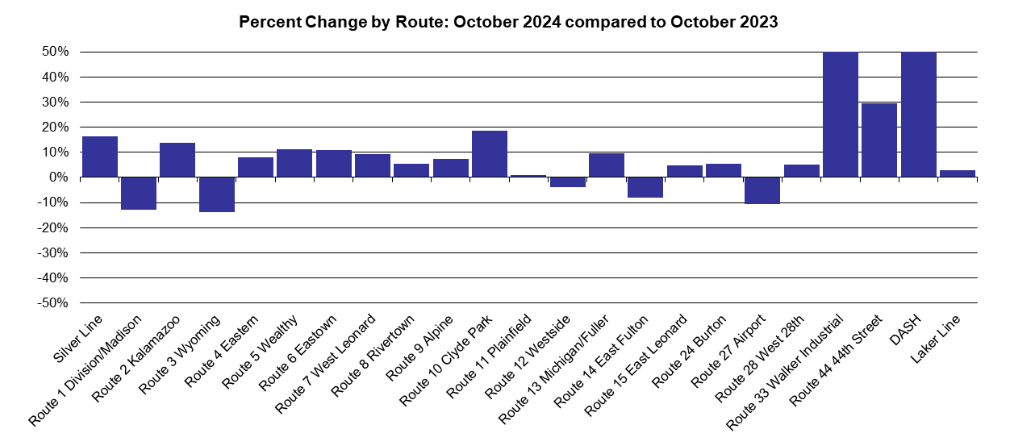
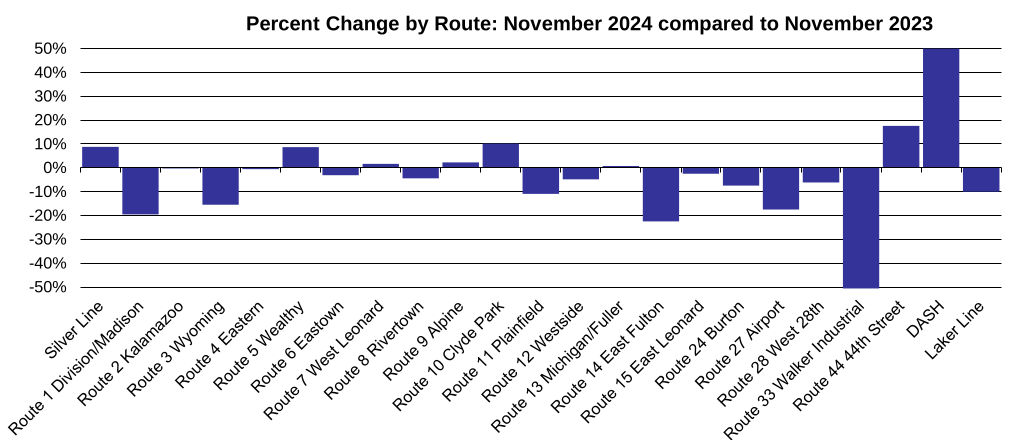
October ridership continued the rebound, up 15.9% from 2023. The largest increases were on Saturdays (+30.7%) which follows the national trend of increases on non-weekday and off-peak ridership. November continued the same pattern with a +4.4% increase overall and a +18% increase on Saturdays. December declined slightly, with Christmas Eve, Christmas Day, and New Years Eve all falling on weekdays. Eight of the twelve months had higher ridership than 2023; with only one significantly down month (June) having no ridership decline attributable to calendar shift or holidays.
November 2024 had one fewer weekday than November 2023, October 2024 had one additional weekday than October 2023.
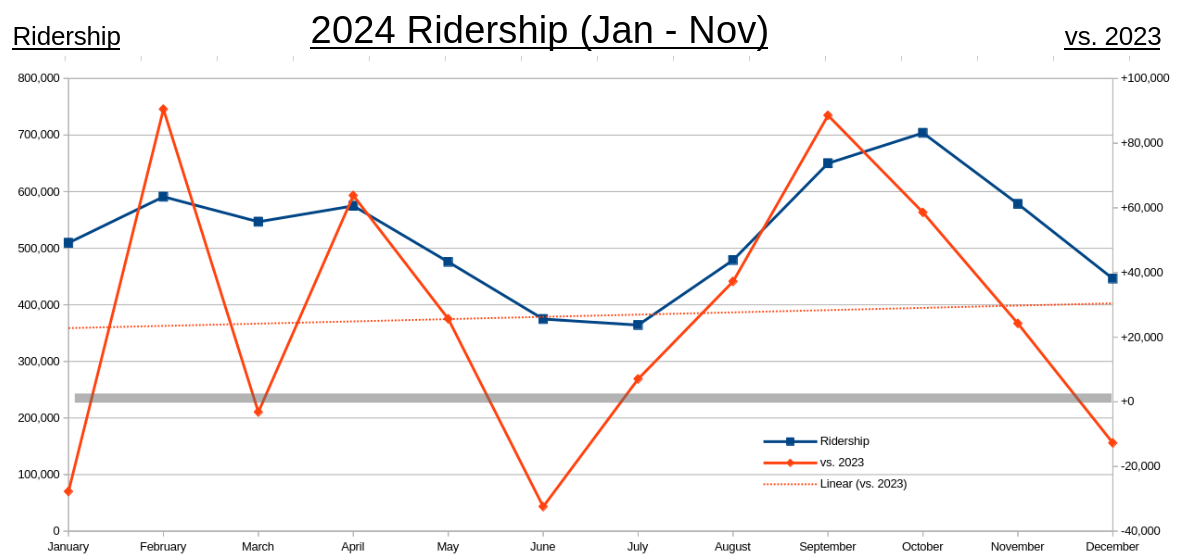
November showed the typically more erratic ridership patterns seen as the holiday period intersects with winter weather.
October Relative Ridership By Route
 < < |
November Relative Ridership By Route
 < < |
The periodic survey of ridership revealed a positive trend: the share of riders earning over $50,000/yr has increased from 2% to 13% in the most recent survey. The middle-class is beginning to return to public transit.
Fare Cap Changes
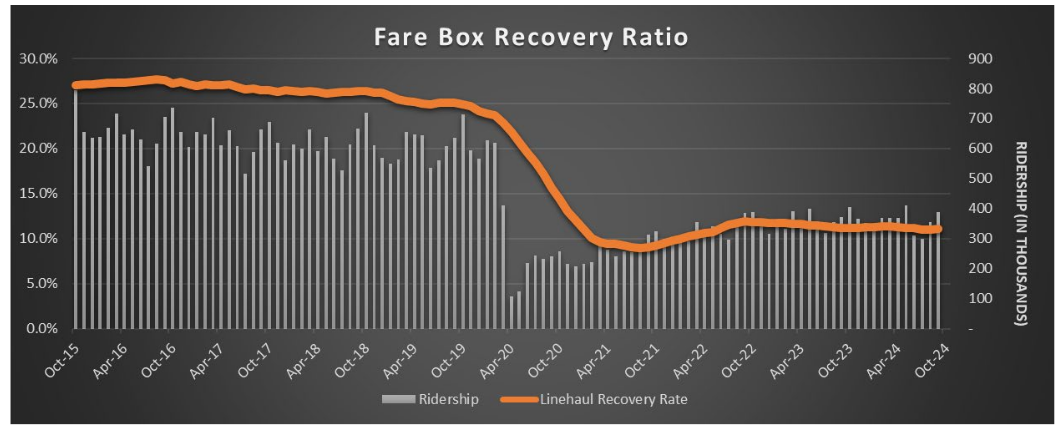
The Rapid's policy is to analyze fares whenever the fare box recovery drops below 25%. Given increased costs and fluctuating ridership that threshold has been reached.
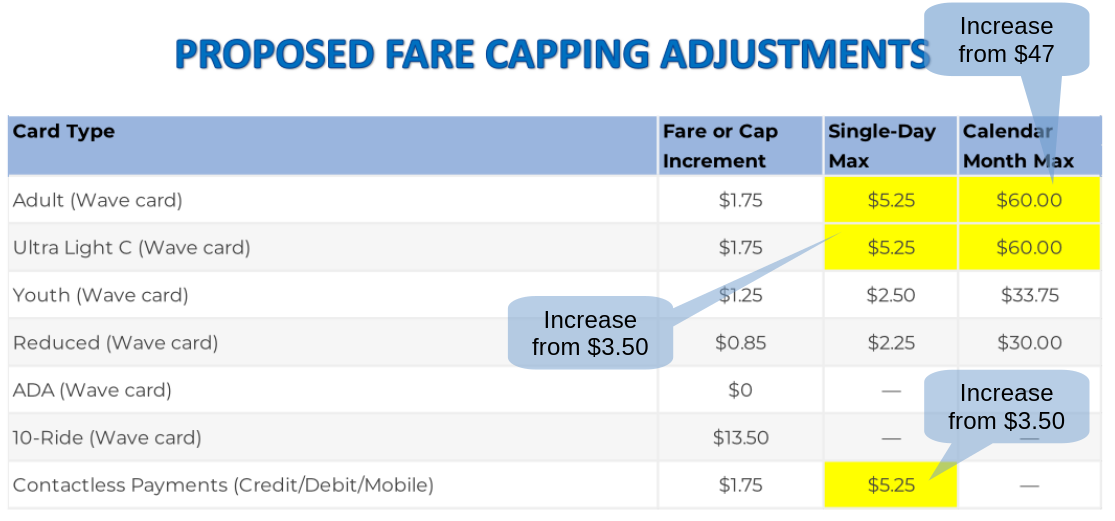
In response to this the Rapid is proposing an increase to the daily fare cap of $3.50 (two trips) to $5.25 (three trips) and an increase in the monthly fare cap from $47.00 (~14 days) to $60.00 (~12 days). The adult fare of $1.75 will not change
The Rapid’s board will make a final decision about the fare changes on January 29th. If the changes are approved they will be effective on April 1st. The fare changes are expected to increase revenues by $187,000.
The Rapid performs disparate impact analysis for all substantive changes, include fares. The analysis of the proposed changes indicate there will not be a disproportionate impact on minority or low-income riders. Only 46% of minority riders and 36% of low-income riders reach the existing daily fare cap on a regular basis; 33% and 43%, respectively, reach the monthly fare cap.
Route 33
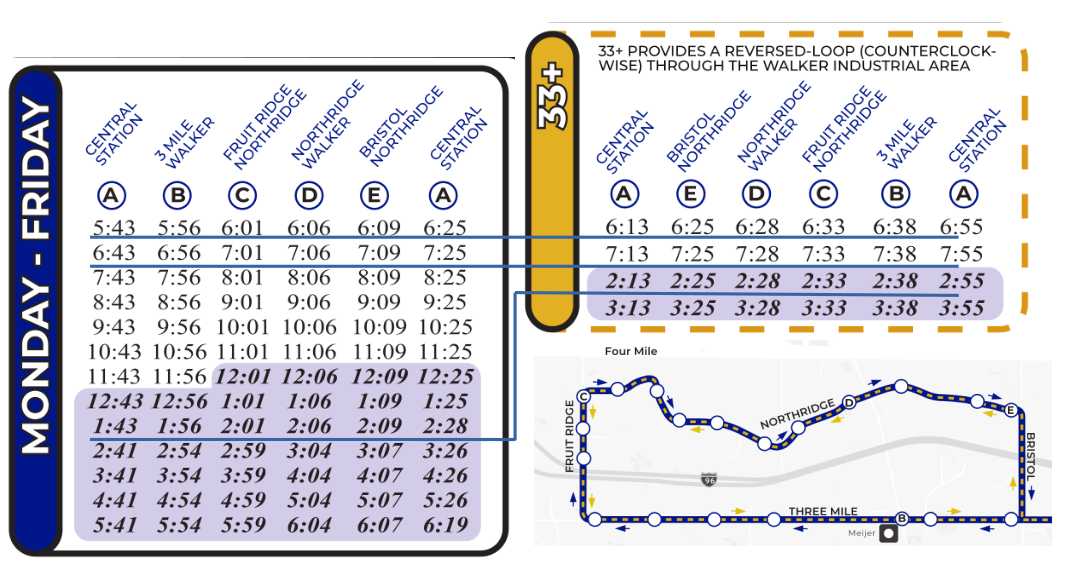
Beginning December 30th (2024) the Rapid increased frequencies on route #33 (Walker Industrial) during early AM and mid-afternoon periods. These increases are intended to offset some of the loss of service due to the closure of the Rapid’s on-demand “Connect” service. The additional frequencies will operate with the identification of “Rapid 33+” and traverse the industrial loop portion of the route in the reverse direction.
Knockback (Schedule Changes)
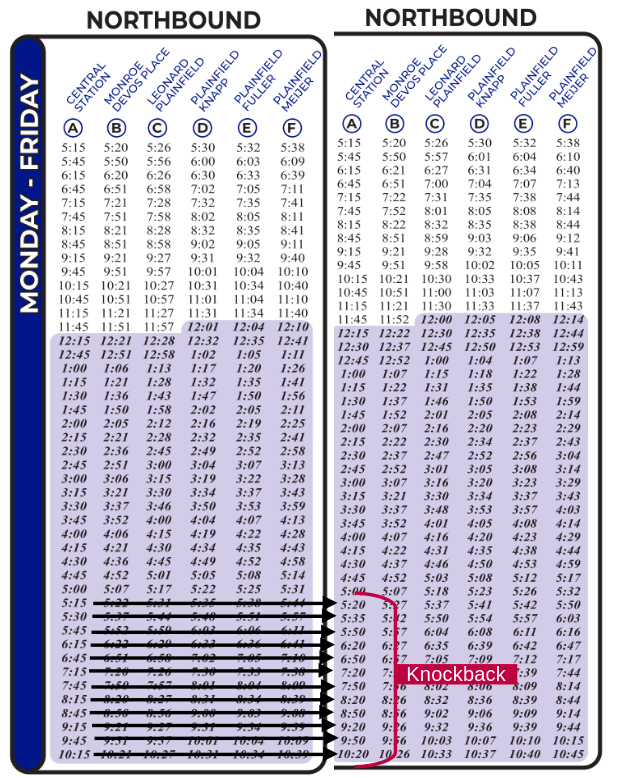
The winter schedule introduced no frequency changes aside from route #33 (Walker Industrial). However the Rapid has implemented a schedule change referred to as “knockback”. This change addresses the decline in On-time Performance (OTP) the system has been experiencing in the later afternoon and evening due to traffic congestion. Buses arriving late into Rapid Central Station result in riders missing their transfers. With the “knockback” change buses leave Rapid Central Station and Kentwood Station five minutes later on weekdays after 5pm. For example a bus previously scheduled to depart Rapid Central Station at 5:15 p.m. will depart at 5:20 p.m.
The DASH
The DASH is the local transit champion! October 2024 ridership increased +130% over 2023 with 38.837 riders. Weekday ridership has increased +70.2% and Saturday ridership +53.1%. Sunday ridership shows the smallest increase at +9.1%. This increase in ridership is a 27.4% decrease in the cost-per-passenger of operating the service. The DASH is anticipated to have closed out the year at ~393,000 riders.
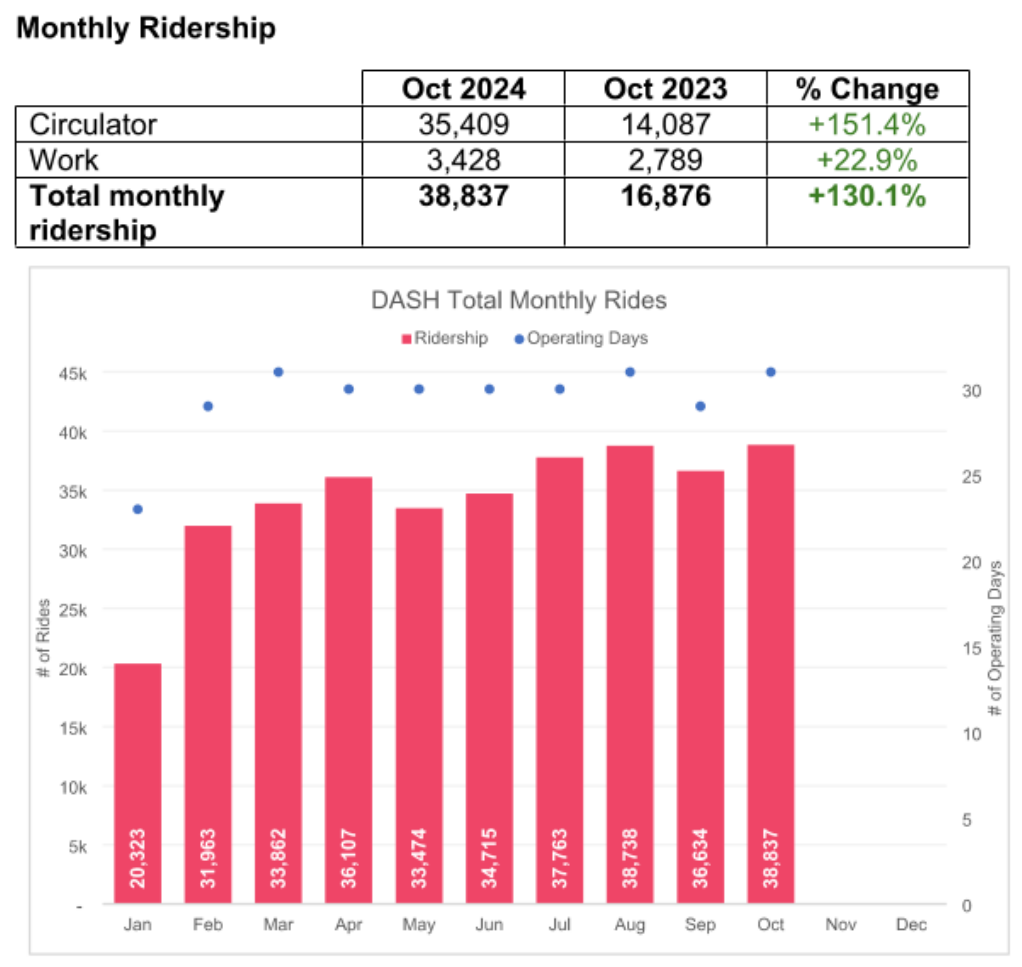
DASH ridership during ArtPrize 2024 - the sixteen (16) days from Sept. 13 - Sept. 28 - was 21,451, which was an +87% increase over ridership during ArtPrize 2023.
Car Share
Drive ARound Town (DART)
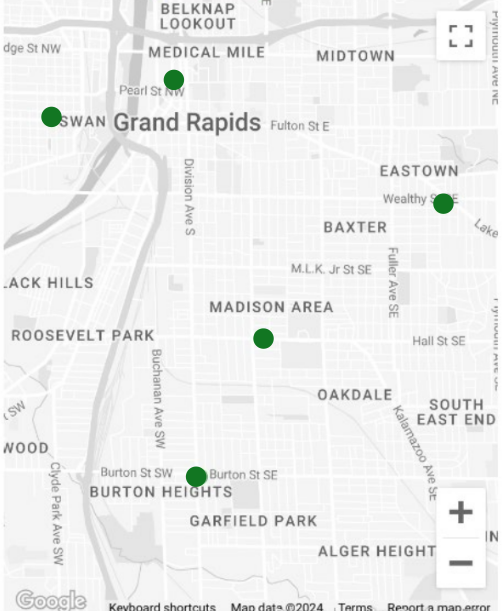
The city’s car share service has now been operational long enough to have a full month of service data. The results indicate strong demand. In the month of November users took 137 trips between the five cars, resulting in a utilization of 12.6 hours per day. MobileGR believes the demonstrated level of demand justifies a fleet of ten (10) cars. A sixth car should be added to the fleet in the coming months. Most additional vehicles will be stationed at existing locations.
You can register for the DART service @ https://dartgr.org/. Reservations, check-ins, and check-outs, are managed through the MDO Carshare mobile application available for Android and iPhone devices. Cost for usage is $5/hr.
DART also operates in Kalamazoo, Detroit, and Ann Arbor. Users registered in Grand Rapids may also use DART vehicles in those cities.
Amtrak
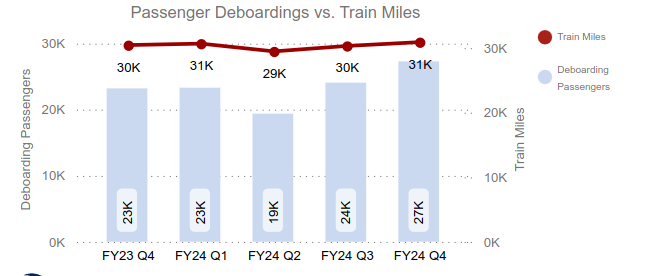
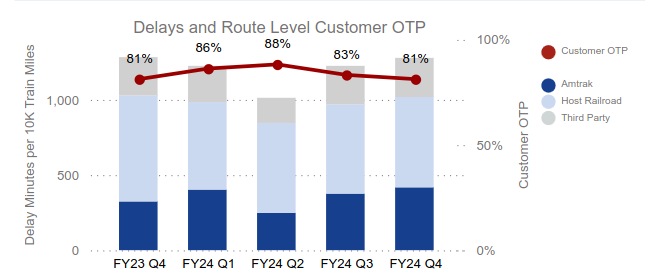
The Pere Marquette ended the Amtrak 2024 fiscal year (ends Sept 30th) with a ridership of 94,381; an increase of 9.9% from fiscal year 2023 (85,845). On-time performance (OTP) ranged from 81% in the fourth quarter to 88% in the second quarter. The cause for train delays was roughly evenly split between freight train interference (FTI: 535 minutes), slow order delays (DSR: 506 minutes), and crew & system issues (SYS: 468 minutes). Slow orders are when trains have to operate at a lower speed, sometimes a much lower speed, due to track issues or the presence of maintenance crews. As infrequently as trains move on north American right-of-way it remains a national embarrassment how poorly the host railroads manage dispatch, which is the cause of the largest category of delays (FTI).
Passengers & Train Miles
 < < |
On-Time Performance
 < < |
The host railroads used by the Pere Marquette are CSX and Norfolk Southern (NS). Across the national system, in fiscal year 2024, CSX freight trains caused total delays of 320 minutes (5.3 hours) and Norfolk Southern trains caused delays of 359 minutes (5.9 hours). Overall on-time performance for state supported routes, across all states, was 73%.
All Michigan routes, which are state supported routes, showed ridership gains over 2023. The Blue Water's ridership increased +3.6% and the Wolverine's increased +1.3%.

