Educational Attainment (2019 - 2023)
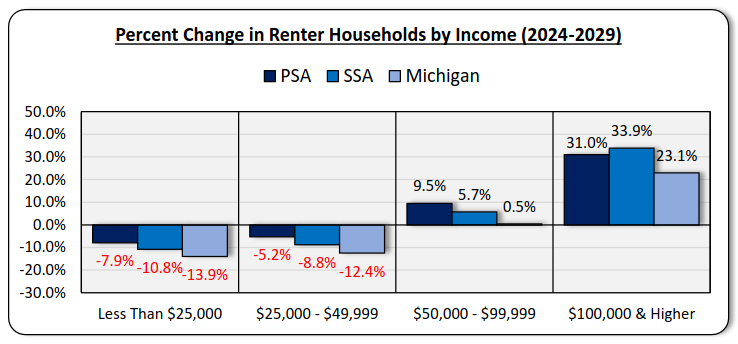
One of the most difficult messages to convey in the housing conversation is that the largest share of people moving to the city are high-income households earning more than 120% AMI; those are households with six figure incomes. The trend impacts everything; it does potentially drive displacement of existing residents as newer households can out-compete existing lower income households, additionally higher income households consume more housing (sq/ft) than lower income households.
Income Cohorts
|
This trend of urbanization of higher income households is often invisible to existing residents. And it can seem counter-intuitive to many. The cultural expectation that when people succeed they move "out" is still commonly held even though it has not been true in a general sense for ~20 years.
“A 2023 survey from the National Association of Realtors found that 77 percent of respondents would pay a premium to live in a walkable neighborhood, and for Gen Z, that figure shot up to 92 percent." - NAR research, 2023
To help understand this phenomenon of household shift let's look at a highly correlating factor: educational attainment.
Highly skilled workers, the kind who work in fields like advanced medicine and FinTech, had been concentrating in cities for more than a decade prior to the pandemic. But the pandemic changed everything! Right? Post-pandemic the highly-educated can "work from anywhere" and have fled the city to shelter in bucolic subdivisions? No. The concentration of the highly-skilled workers in urban areas has continued.
This is data from 2019 - 2023, jumping over the pandemic until now-ish. The share of the population of the city in the highest categories of education attainment has only increased. The numbers are especially notable if the census' determination that the city's population has plateaued in recent years is correct. The city's growth in the share highly skilled workers easily surpasses that of the county, the state, and the nation overall.
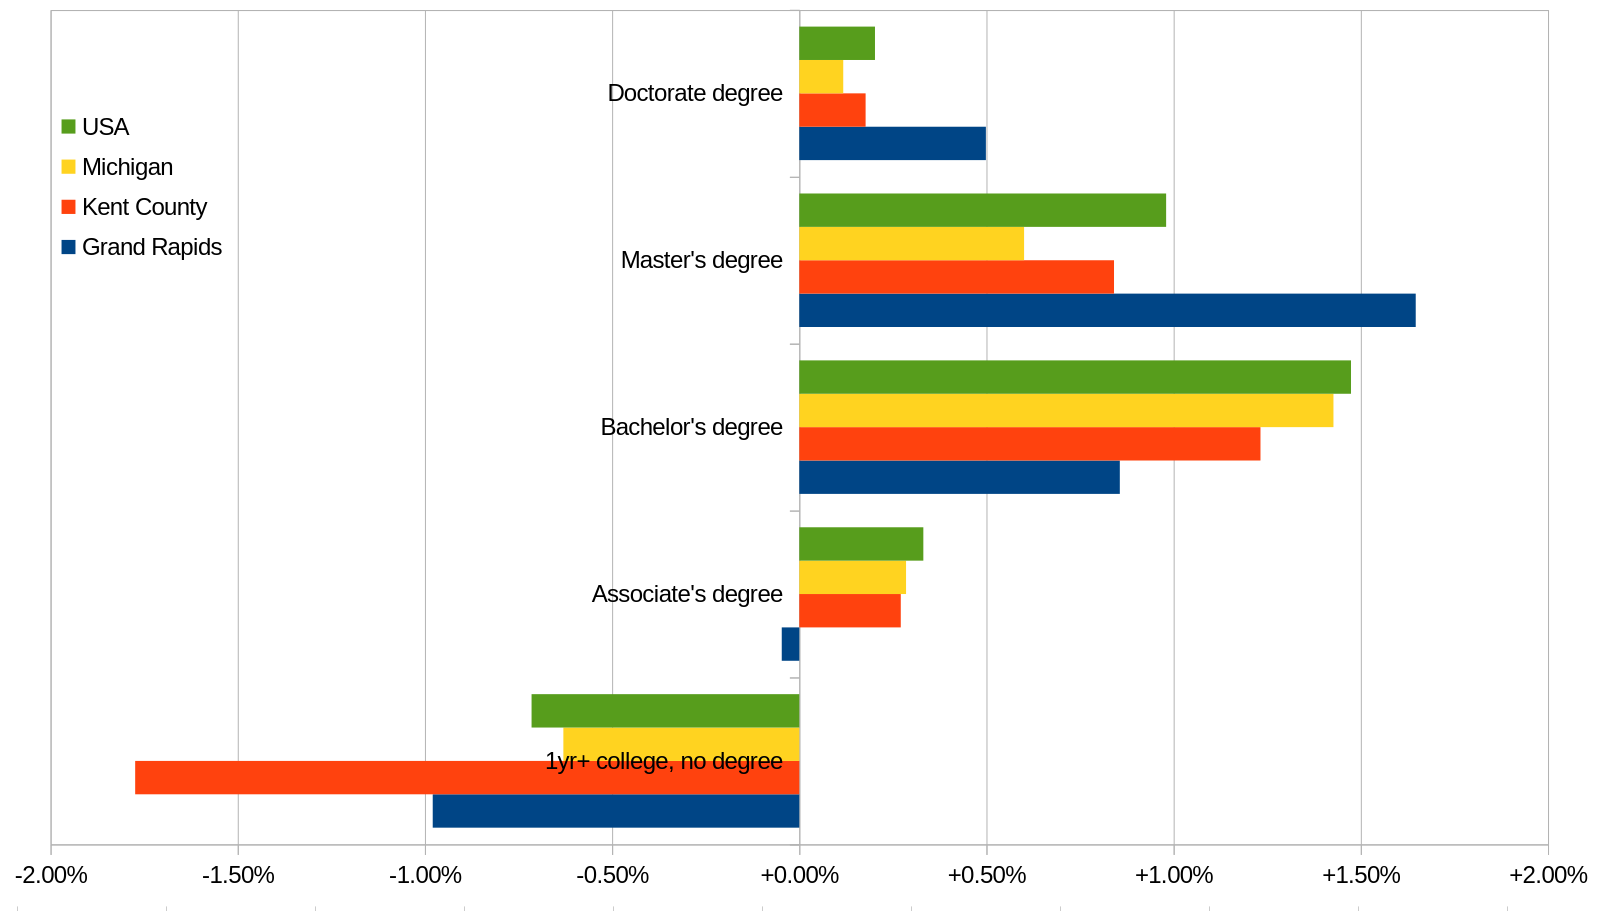
Change in Educational Attainment
|
Yes, someone working in FinTech or as an Associate Veterinarian ($130,000/yr - $180,000/yr) can afford that $3,200/mo rent or housing payment. This is a bitter pill for someone struggling to afford housing, but denying the reality of the situation helps nobody. It has never been more important to allow, and invest in, new housing types: Accessory Dwelling Units, mutli-family infill, micro-units, and, well, every option there is. Now.
And there is an upside: that Associate Veterinarian and her partner who works in Fintech will be paying $3,900/yr - $5,400/yr in income taxes to the city's general fund which the elected representatives of the people can then choose how to invest back into the city and its residents. We want everyone to have safe and affordable [to them] housing, in beautiful neighborhoods, with access to all the amenities urban living should provide. If we are smart, and if we have empowered city leadership, those households moving into the city can help make that a reality.
The Data
2019
| Attainment | National | Michigan | Kent County | Grand Rapids |
|---|---|---|---|---|
| High school diploma | 51,584,272 | 1,732,283 | 91,611 | 25,593 |
| GED or alternative credential | 8,898,081 | 273,698 | 12,086 | 3,914 |
| College, 1yr or more years, no degree | 31,007,878 | 1,056,955 | 68,922 | 19,631 |
| Associate's degree | 19,381,937 | 648,794 | 38,524 | 10,099 |
| Bachelor's degree | 45,730,479 | 1,252,685 | 104,451 | 32,973 |
| Master's degree | 20,555,510 | 606,220 | 40,427 | 10,574 |
| Doctorate degree | 3,323,850 | 85,443 | 5,342 | 1,669 |
2023
| Attainment | National | Michigan | Kent County | Grand Rapids |
|---|---|---|---|---|
| High school diploma | 50,835,531 | 1,657,737 | 84,788 | 20,567 |
| GED or alternative credential | 9,270,393 | 284,185 | 11,931 | 4,520 |
| College, 1yr or more years, no degree | 28,660,664 | 994,014 | 56,470 | 17,663 |
| Associate's degree | 20,469,668 | 677,286 | 41,526 | 10,005 |
| Bachelor's degree | 50,567,878 | 1,395,186 | 123,437 | 34,694 |
| Master's degree | 23,772,531 | 666,196 | 48,088 | 13,884 |
| Doctorate degree | 3,987,775 | 97,166 | 6,915 | 2,671 |
The Delta
The winner of each category is bold.
| Category | Grand Rapids | Kent County | Michigan | USA |
|---|---|---|---|---|
| College, 1yr or more years, no degree | -0.98% | -1.77% | -0.63% | -0.72% |
| Associate's degree | -0.05% | +0.27% | +0.29% | +0.33% |
| Bachelor's degree | +0.86% | +1.23% | +1.43% | +1.47% |
| Master's degree | +1.65% | +0.84% | +0.60% | +0.98% |
| Doctorate degree | +0.50% | +0.18% | +0.12% | +0.20% |
Related
- The Latest On Metro Areas and Educational Attainment, Corner Side Yard 2025-09-05
- State backs Grand Rapids fintech expansion with $500K grant, Crains 2023-05-18
- Insurance brokerage moving HQ, 120 employees to downtown Grand Rapids, Crains 2025-03-27
- Insurance brokerage Hylant scaling up downtown office with move to Trust Building, Crains 2025-05-15
Acrisure ‘put Grand Rapids on the map.’ Now the insurance industry is flocking to the city., Crains 2025-04-24
As of 2024, the insurance industry employed 11,700 people in the Grand Rapids metropolitan area, with average earnings per job of $97,717,Paying More to Drive Less, Slate 2023-01-27
- Housing NEXT Needs Update (2025), UrbanGR 2025-07-14